Welcome to the final lesson of your course on clinical laboratory interpretation! We've journeyed from the fundamentals of test characteristics all the way to handling life-threatening critical values. In our last lesson, we focused on that "first responder" mindset—recognizing and acting on results that pose an immediate danger.
Today, we take the final and most crucial step: synthesis. This lesson is the capstone of the course, where we'll bring everything together to practice the true art of clinical medicine. Our goal is to correlate laboratory patterns with patient history and physical exam findings to refine clinical judgment. We will move beyond interpreting single values or panels and learn to weave the patient's story, physical signs, and a wide array of data into a coherent clinical picture. This is the skill that distinguishes a data-reader from a diagnostician.
1. The Primacy of Clinical Context
Before we dive into cases, let's establish our foundational principle: a lab test in isolation means very little. Its value comes from its context. A great clinician treats the patient, not the blood test.
To solidify this mindset, let's review a short but essential guide on this topic.
Blood Test Interpretation Guide | Labs
The Geeky Medics guide, 'Blood Test Interpretation Guide,' provides an excellent framework for thinking like a seasoned clinician. It emphasizes that context is everything.
Please read the sections titled 'Consider the clinical context,' 'Reference ranges (not “normal ranges”),' and 'Identify and act on critical results.' Pay special attention to the questions 'who, why, and what' and the concept of looking at trends versus isolated values.
This reading reinforces several key ideas:
- A blood test is a single pixel; the full clinical picture is the image.
- Trends over time are often more informative than a single abnormal result. A falling white blood cell count in a patient being treated for cellulitis is reassuring, while a rising one is alarming.
- "Normal" is relative. A hemoglobin of 13 g/dL is within the reference range but could represent a life-threatening bleed in a patient with polycythemia whose baseline is 18 g/dL.
This holistic view, often called a symptom-based approach, means you weigh the patient's signs and symptoms heavily, sometimes more than the isolated lab value itself. A patient with a low hemoglobin who is asymptomatic and hemodynamically stable presents a very different challenge from a patient with the same hemoglobin value who is dizzy, tachycardic, and pale.
2. Case Study 1: Synthesizing the Picture of Sepsis
Let's apply this thinking to a common and complex scenario. A critically ill patient rarely presents with just one abnormal lab value. Instead, you'll see a constellation of findings across multiple panels that, together, tell a story.
Complete Blood Count (CBC) Case - Lab Results Interpretation: Thrombocytopenia & Leukocytosis
This MedCram video walks through a classic case of a patient presenting with sepsis. It's a perfect example of how history, physical exam, vitals, labs, and imaging must all be integrated to understand the full picture and guide management.
Please watch the entire video (around 7 minutes). As you watch, try to connect the dots yourself: History: What historical clue is provided that might explain the patient's presentation? Exam & Vitals: What do the physical findings and vital signs immediately tell you about the patient's physiological state? Labs: How do the CBC and Chemistry panel abnormalities reinforce the picture of septic shock and point towards specific organ dysfunction? Synthesis: How does the speaker put all these pieces together to arrive at a diagnosis and a management plan?
Let's break down the synthesis in this case:
- The Story (History): The patient is a 60-year-old male with diarrhea, fever, chills, and dizziness. The crucial clue, obtained later, is a past UTI treated with antibiotics. This history immediately raises suspicion for Clostridioides difficile (C. diff) colitis, a known complication of antibiotic use.
- The Body (Exam/Vitals): The patient is hypotensive (85/55), tachycardic (135), and febrile (38.3°C). This is the classic picture of septic shock. The dry mucous membranes and lethargy point to significant dehydration.
- The Data (Labs & Imaging):
- CBC: The extremely high WBC (55.0) is a leukemoid reaction, a hallmark of severe infection, and is particularly associated with C. diff. The low platelets (85) suggest consumptive coagulopathy from sepsis. The high hemoglobin (16.0) is paradoxical in a sick patient and points to hemoconcentration from dehydration.
- Chemistry: The low bicarbonate (13) and calculated anion gap of 18 indicate a high anion gap metabolic acidosis, likely from lactic acidosis due to shock. The elevated BUN (30) and Creatinine (1.5) signal an acute kidney injury (AKI). The low potassium (3.0) is consistent with losses from diarrhea.
- Imaging: The CT scan showing sigmoid colon wall thickening confirms the site of infection.
Refining Clinical Judgment:
No single piece of data tells the whole story. An elevated WBC alone could be many things. Diarrhea is common. But when you combine the history of antibiotic use with the lab pattern of a leukemoid reaction, metabolic acidosis, AKI, and hemoconcentration, and then confirm with imaging, the diagnosis of septic shock with multi-organ dysfunction (AKI, acidosis) secondary to severe C. diff colitis becomes clear.
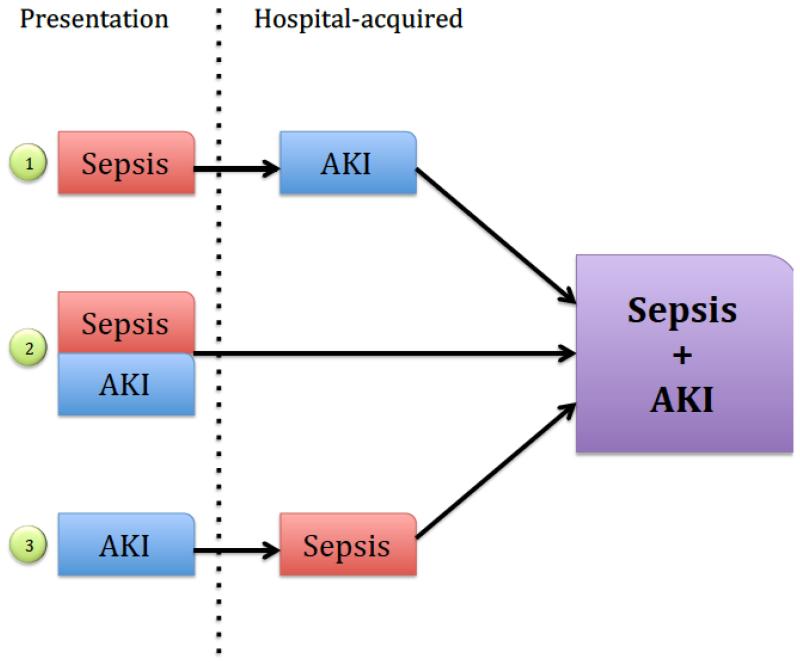
Test your understanding!
In the video case, the patient's hemoglobin was 16.0 g/dL (normal for a male is ~14-18 g/dL). Why is this "normal" value actually a key piece of evidence supporting the diagnosis of severe dehydration and shock, rather than a reassuring finding?
Show answer
In a critically ill, septic patient, you would expect stress and inflammation to potentially lower the hemoglobin. More importantly, the patient is receiving IV fluids for resuscitation, which should dilute the blood and lower the hemoglobin and hematocrit. A hemoglobin of 16.0 in this context suggests significant hemoconcentration — the blood is "thicker" because of profound fluid loss (from diarrhea and third-spacing). This "normal" value, when interpreted in context, is actually a marker of severe volume depletion.
3. Case Study 2: A Systematic Approach to Anemia
Anemia is another area where correlating the history with lab patterns is paramount. The initial CBC indices (like MCV) give you a starting point, but the patient's history, diet, family background, and medications are what truly guide your workup.
The Ninja Nerd channel provides an exhaustive, systematic approach to working up anemia. We'll focus on the case studies at the end, which are rapid-fire examples of correlating history and labs.
Please watch the case studies section, from 45:26 to 54:02. You don't need to memorize every detail. Instead, for each case, focus on how the presenter uses a key piece of history or patient profile combined with the lab pattern to arrive at the likely diagnosis.
Let's pull out a few examples from the video to see this in action:
-
Case 1 (Iron Deficiency Anemia):
- History: 26-year-old female with heavy menstrual periods.
- Lab Pattern: Retic <2% (underproduction), MCV 75 (microcytic), RDW high, Ferritin low.
- Synthesis: The history provides a clear source of chronic blood loss. The lab pattern is the classic signature of iron deficiency. The history and labs are perfectly congruent.
-
Case 2 (Anemia of Chronic Disease):
- History: 85-year-old female with SLE (Systemic Lupus Erythematosus), a chronic inflammatory condition.
- Lab Pattern: Retic <2% (underproduction), MCV 75 (microcytic), RDW normal, Ferritin high.
- Synthesis: The high ferritin (an acute phase reactant) in the setting of a known inflammatory disease (SLE) is the key. This isn't iron deficiency; it's a problem of iron utilization due to inflammation.
-
Case 4 (Thalassemia):
- History: 34-year-old female of Mediterranean ancestry with persistent anemia despite iron supplementation.
- Lab Pattern: Retic <2%, MCV 65 (very microcytic), Red Blood Cells normal/high, Mincer's index <13.
- Synthesis: The combination of ethnic background (high prevalence of thalassemia), a very low MCV, and a normal RBC count (in thalassemia, many small cells are produced) points away from iron deficiency and strongly towards thalassemia. The failure to respond to iron is another huge clue.
In each case, the lab pattern alone provides a differential, but it's the patient's story that allows you to zero in on the most probable diagnosis.
4. Case Study 3: Predicting Labs in Acute Liver Failure
A powerful way to refine your clinical judgment is to use the patient's history to predict the lab findings before you even see them. Let's try this with a case of acute liver failure.
Vignette: A 19-year-old college student is brought to the emergency department by their roommate for confusion and lethargy. The roommate found an empty bottle of acetaminophen next to the patient. On exam, the patient is jaundiced and has right upper quadrant tenderness.
Now, let's use a flowchart to connect this story to the expected lab abnormalities.

Based on the history (acetaminophen overdose) and the flowchart, what lab pattern would you expect to see?
- Hepatocellular Injury: Acetaminophen overdose causes massive hepatocellular necrosis. You would predict astronomically high aminotransferases (AST and ALT in the thousands or tens of thousands).
- Impaired Synthesis: The liver's synthetic function fails. You would predict a rising INR (due to decreased synthesis of coagulation factors) and low albumin (though albumin has a long half-life, so this might not be immediate).
- Impaired Metabolism/Excretion: The liver can't process bilirubin or toxins. You'd predict a rising serum bilirubin (causing the jaundice) and a rising ammonia level (leading to hepatic encephalopathy and the patient's confusion).
Seeing this full pattern—sky-high transaminases, coagulopathy (high INR), and hyperbilirubinemia—in a patient with a history of acetaminophen ingestion confirms the diagnosis of acute liver failure.
Conclusion: The Complete Clinician
Congratulations on completing the course! You've built a robust foundation for interpreting laboratory data, from understanding individual tests to reacting to critical values. This final lesson was about the most important step: integration. True clinical mastery lies not in knowing what each lab value means, but in understanding what they mean together, for a specific person, at a specific moment in time.
Key Takeaways:
- Always interpret labs in the context of the patient's history, physical exam, and trends over time. Treat the patient, not the numbers.
- Look for patterns across different lab panels. A CBC abnormality combined with a BMP abnormality tells a richer story than either one alone.
- Use the patient's story to form a hypothesis, and then use the lab patterns to test and refine it.
- The symptom-based approach is key. The same lab value can mean very different things depending on whether the patient is symptomatic or not. The tables in the "LABORATORY VALUES INTERPRETATION RESOURCE" outlining "Presentation" and "Clinical Implications" are excellent tools for connecting data to symptoms.
As you continue your medical training, this skill of synthesis will be your most powerful tool. It is the core of diagnostic reasoning and the essence of what it means to be a thoughtful and effective doctor. We wish you the very best in your journey to becoming one.