Hello! Welcome to the second lesson in our course on mastering the clinical interpretation of laboratory results.
In our first lesson, we established a framework for evaluating a test's performance using sensitivity, specificity, and predictive values. You learned that even a good test can be misleading depending on the clinical context, particularly the prevalence of the disease.
Today, we'll tackle the next crucial step in interpretation. When you look at a lab report, you see your patient's result next to a "reference range," often flagged as "High" or "Low." What does this flag really mean? This lesson will teach you how to interpret reference ranges and distinguish between a result that is merely statistically abnormal and one that is truly clinically significant. This skill is fundamental to avoiding both unnecessary anxiety and costly investigations, as well as preventing the dismissal of a subtle but important clue.
1. "Normal" is a Statistic, Not a Guarantee
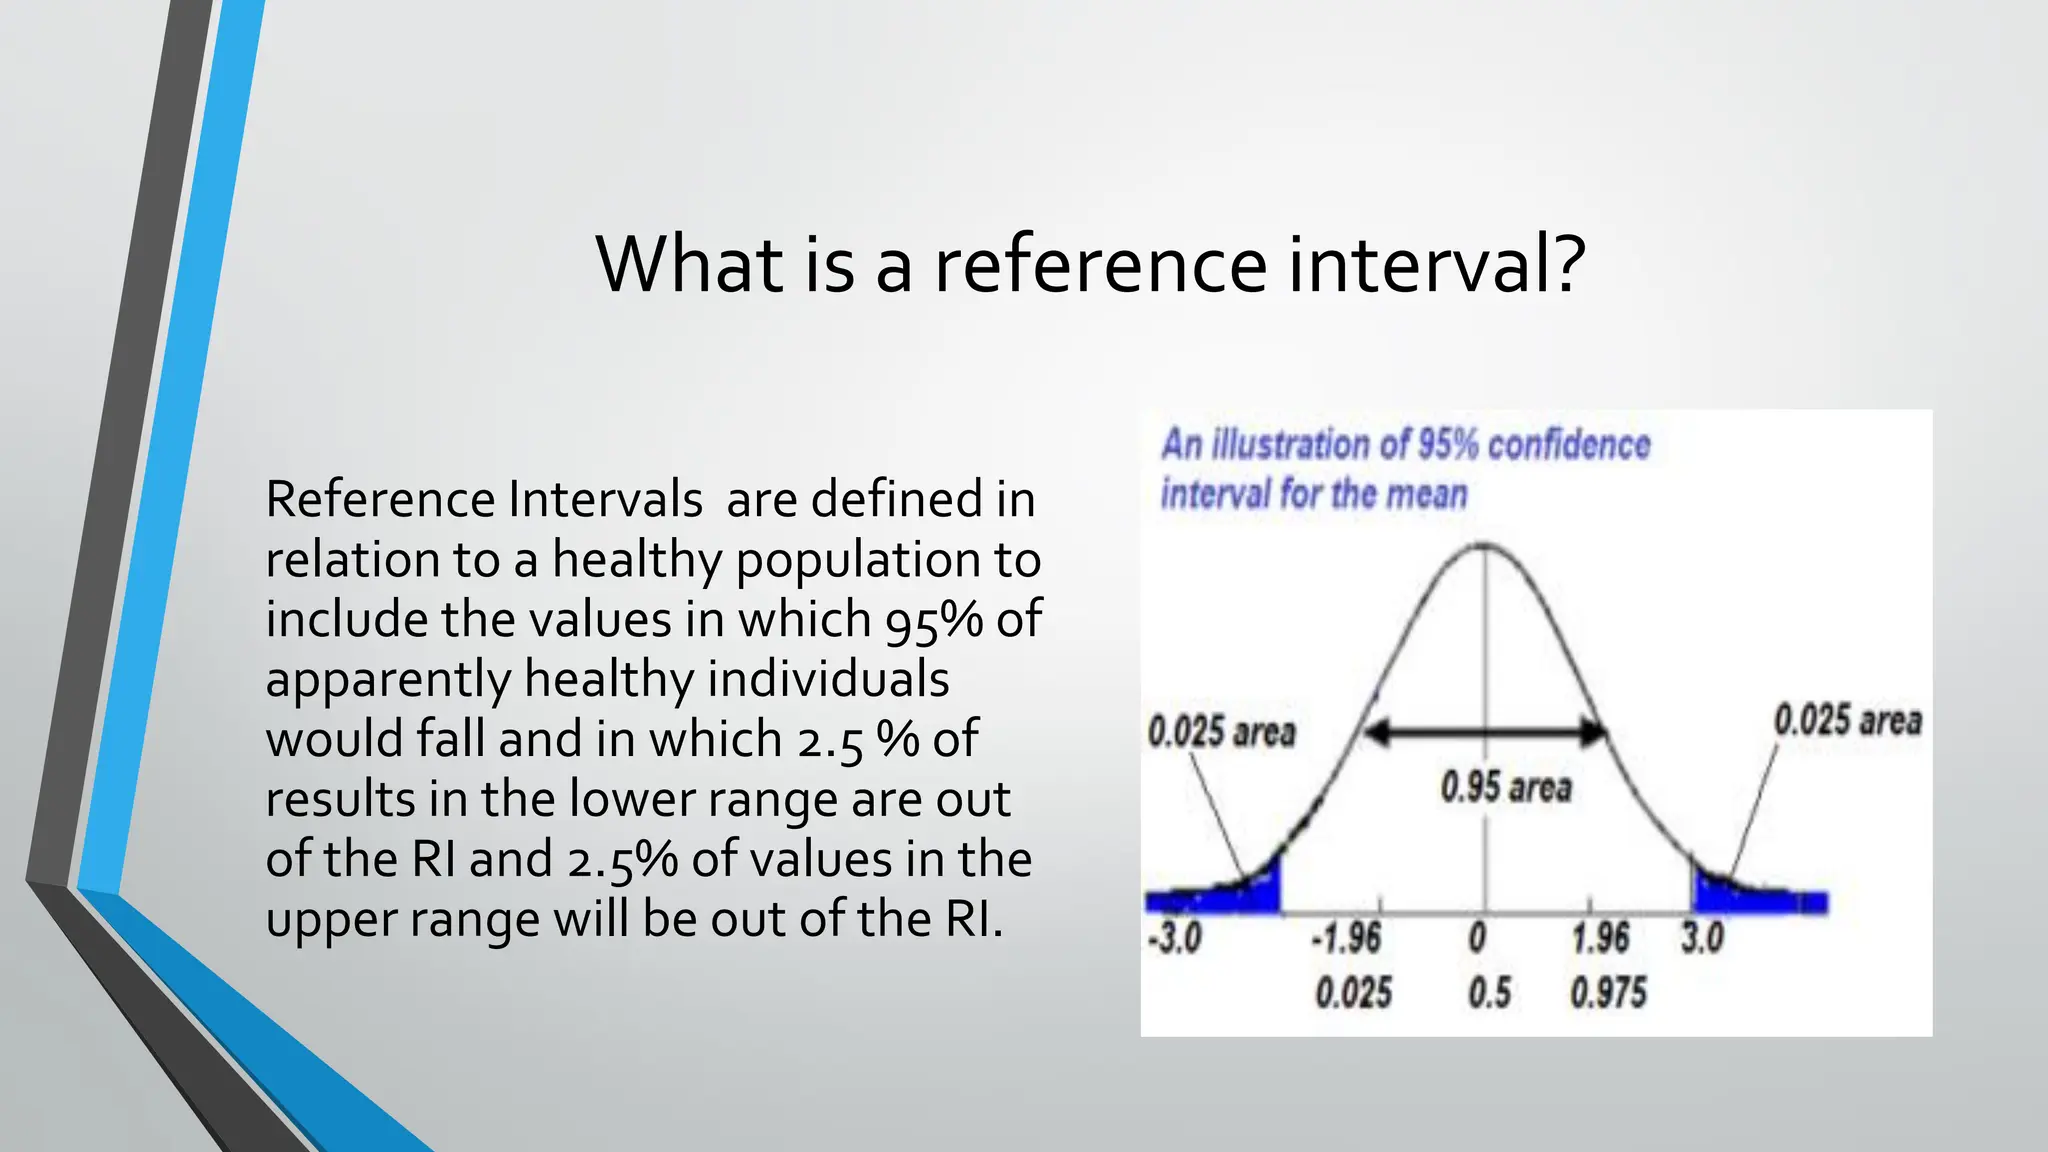
The first thing to understand is that the "normal range" you see on a lab report is more accurately called a reference interval. It's not a black-and-white cutoff between health and disease. It is a statistical definition.
So, how is this range determined?
Introduction to lab values and normal ranges | Health & Medicine | Khan Academy
This Khan Academy video provides a clear explanation of the statistical basis for reference intervals. It will help you understand why a certain percentage of healthy people will always have 'abnormal' results.
Please watch from 5:10 to 7:22. Focus on how the bell curve is used to define the 'normal range' as the central 95% of a healthy population.
As the video explains, a reference interval is typically constructed by measuring a substance in a large, apparently healthy population and then calculating the range that encompasses the central 95% of those results.
This has a profound and immediate implication for you as a clinician:
- For any single test, 5% of healthy people will have a result outside the reference interval by pure chance.
- When you order a panel of tests, like a Comprehensive Metabolic Panel (CMP) with 14 different analytes, the probability of at least one of those results being flagged as 'abnormal' in a healthy person becomes very high. For a 20-test profile, it's statistically likely that at least one result will be out of range.
To dig a bit deeper into this concept and its limitations, the following article is an excellent read.
When is “abnormal” abnormal? Dealing with the slightly out of range laboratory result
This article, 'When is “abnormal” abnormal?', directly addresses the dilemma of a slightly out-of-range result. It's a great clinical perspective on the statistical concepts we've just discussed.
Read the 'Short abstract' and the section titled 'What can we do about the current 95th centile reference range?'. This will reinforce why reference ranges are an 'inexact science.'
Furthermore, these ranges are not one-size-fits-all. A 'normal' value can be influenced by many factors.
Introduction to lab values and normal ranges | Health & Medicine | Khan Academy
Let's return to the Khan Academy video to see a breakdown of the factors that can influence an individual's lab results, making context essential for interpretation.
Now watch from 7:22 to 10:41. Pay attention to the list of variables like age, gender, lab technique, and patient-specific situations (e.g., fasting, medications) that can affect results.
2. Clinical Significance vs. Statistical Abnormality
So, if a value outside the reference interval doesn't automatically mean disease, how do you decide when to be concerned? This is the art of medicine: moving from seeing a statistical anomaly to identifying a clinically significant finding.

Here is a practical framework for determining clinical significance.
A. The Trend is More Powerful Than the Snapshot
A single lab result is just a snapshot in time. The most powerful way to interpret a value is to compare it to previous results.
Lab Results, Values, and Interpretation (CBC, BMP, CMP, LFT)
This clip from MedCram offers a superb analogy and a perfect clinical example illustrating the importance of trending lab values.
Watch from 3:37 to 4:57. Focus on the sodium example: a series of results all within the 'normal' range can still reveal a clinically significant—and dangerous—trend.
As you saw, a sodium level of 144 mEq/L is statistically normal. But if it was 139 yesterday and 135 the day before, you have an evolving hypernatremia that requires immediate attention. Conversely, a slightly elevated potassium that has been stable for years is far less concerning than one that has acutely risen.
B. The Magnitude of the Abnormality Matters
A result that is slightly outside the reference interval is less likely to be significant than one that is grossly abnormal. This might seem obvious, but there's a statistical basis for this intuition.
The article "When is 'abnormal' abnormal?" provides a pragmatic way to think about this, distinguishing between results just outside the 95th centile and those that are even more extreme (e.g., outside the 99.9th centile).
When is “abnormal” abnormal? Dealing with the slightly out of range laboratory result
Let's revisit the article by Dr. Smellie for some practical advice on how to act based on the magnitude of an abnormal result.
Please read the sections '95th or 99.9th centile of the reference population' and 'What action should we recommend for slightly abnormal results?'. Note the suggestion to retest minimally abnormal results in asymptomatic patients, but to investigate results that are far outside the range.
The key takeaway here is the concept of regression to the mean. A slightly abnormal value will often return to normal on its own upon retesting. However, a result that is statistically very unlikely to have occurred by chance (e.g., beyond 3 standard deviations from the mean, or outside the 99.9% range) is much more likely to be clinically significant.
C. The Clinical Context is King
This is the most important principle. A lab result can only be interpreted in the context of your patient. You must apply a "clinical filter" before and after ordering a test.
Lab Results, Values, and Interpretation (CBC, BMP, CMP, LFT)
This final clip from MedCram drives home the point that lab values must align with the clinical picture. It provides an excellent example of when to trust the patient over a questionable lab value.
Watch from 6:20 to 9:13. Focus on the hyperkalemia example. A critically high potassium level demands confirmation (e.g., with an EKG) before initiating potentially harmful treatment, especially if it doesn't fit the patient's presentation.
The hyperkalemia example is perfect:
- High Potassium + Peaked T-waves on EKG: This is a true medical emergency. The clinical data and lab data are concordant.
- High Potassium + Normal EKG: This should raise immediate suspicion for a pre-analytical error, such as a hemolyzed blood sample. Acting on this number alone could cause dangerous hypokalemia.
This ties back to our previous lesson. In a patient with a low pre-test probability of disease (e.g., a healthy young person with non-specific symptoms), an isolated, slightly abnormal result has a low post-test probability of being significant.
Test your understanding!
A 45-year-old woman with no past medical history comes in for a routine check-up. She feels well. As part of her screening labs, her alkaline phosphatase (ALP) comes back at 130 U/L (lab reference range: 44-121 U/L). All other liver function tests are normal. Her previous labs from two years ago show an ALP of 125 U/L.
Which of the following is the most appropriate next step?
A) Immediately order an abdominal ultrasound to evaluate for biliary obstruction.
B) Tell the patient she has liver disease and refer her to a specialist.
C) Note the stable, mild elevation in an asymptomatic patient and plan to recheck in 6-12 months.
D) Start treatment for liver disease.
Show answer
The correct answer is C.
Here's the reasoning:
- Magnitude: The result is only slightly above the upper limit of normal.
- Trend: It is stable compared to two years ago. There is no alarming upward trend.
- Clinical Context: The patient is asymptomatic, and the rest of her liver panel is normal. This lowers the pre-test probability of significant liver or biliary disease.
Therefore, this is likely a case of a person whose individual 'normal' is simply higher than the 97.5th percentile of the reference population. Immediate, aggressive investigation (A) or diagnosis (B) is not warranted. Treatment (D) is inappropriate. The most prudent course is observation.
Conclusion
Interpreting a single lab value is a nuanced process that goes far beyond checking if it's inside or outside the "normal range."
Key Takeaways:
- Reference Intervals are Statistical: They typically represent the central 95% of a healthy population, meaning 1 in 20 healthy people will have an 'abnormal' result for any given test by chance.
- Clinical Significance Trumps Statistical Abnormality: Your primary goal is to determine if a result is clinically meaningful for your patient.
- Use a Systematic Approach: When you see an abnormal result, always assess:
- The Trend: Is the value changing over time?
- The Magnitude: How far outside the range is it?
- The Clinical Context: Does it fit with the patient's history, physical exam, and other test results?
Never treat a number in isolation. As the MedCram video suggests, lab results are your instruments, but you are the pilot flying the plane. They must be interpreted in light of what you see out the window—your clinical assessment of the patient.
Next Steps
We've now seen how the statistical nature of reference intervals can produce "abnormal" results, and how a surprising lab value might be questioned if it doesn't fit the clinical picture. A common reason for such a discrepancy is an error that occurs before the sample is even analyzed. In our next lesson, we will identify common sources of pre-analytical error that can invalidate laboratory results, giving you another critical tool for your interpretation toolkit.