Hello! Welcome to the first lesson in our course on mastering the clinical interpretation of laboratory results.
As a medical student, you're already encountering lab tests on your rotations. The goal of this course is to equip you with a systematic and practical framework to interpret them effectively. We'll start today with the absolute foundation: understanding how to evaluate the performance of any diagnostic test. Before we can decide what an abnormal result means for a patient, we need to know how reliable the test is at distinguishing between health and disease.
This lesson will focus on explaining the core concepts of sensitivity, specificity, positive predictive value (PPV), and negative predictive value (NPV). Mastering these will give you the language and tools to critically appraise any lab test you encounter, a crucial skill for evidence-based practice.
1. The Four Possible Outcomes of a Test
Every time we run a diagnostic test, there are four possible outcomes based on the test result and the patient's true disease status. To keep these organized, we use a standard 2x2 table.
To begin, let's watch a short video that introduces this framework and defines the four key terms: true positive, false positive, false negative, and true negative.
Clinical Reasoning 6: Sensitivity, Specificity & Predictive Values
This video from Dr. Rahul Patwari provides a clear, visual introduction to the basic concepts of diagnostic testing. It will help you build a solid mental model for the rest of the lesson.
Please watch from the beginning until the 3:37 mark. Focus on understanding the definitions of true/false positives and negatives and how they are organized into the 2x2 table.
To summarize, the 2x2 table helps us organize the outcomes like this:
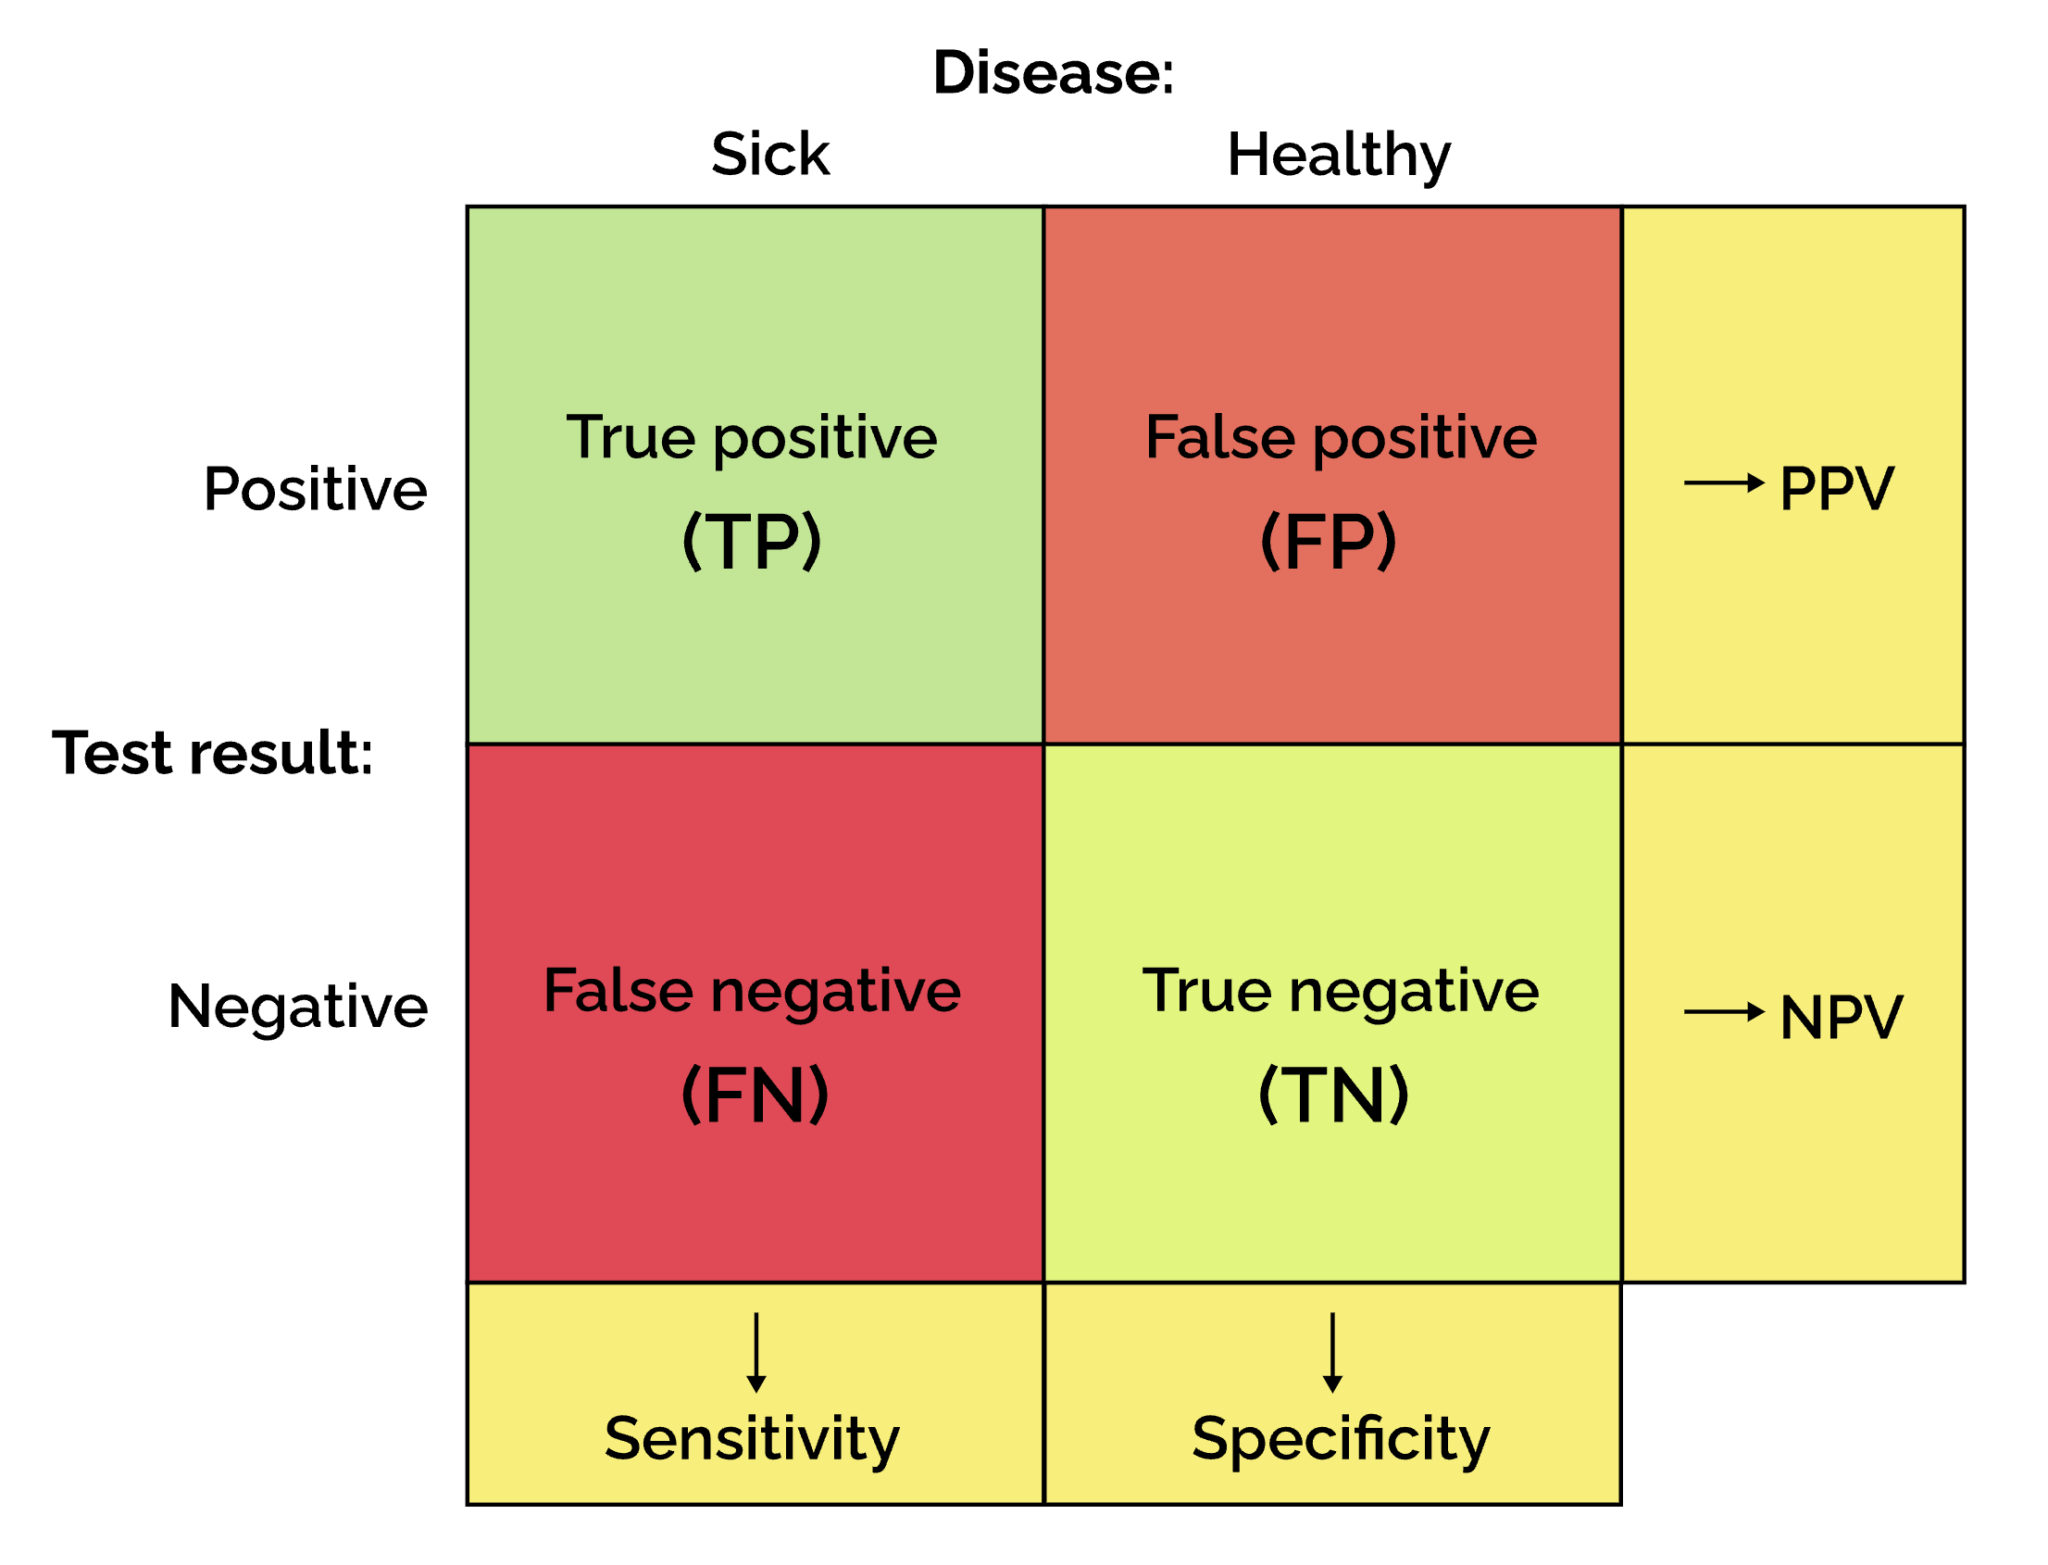
- True Positive (TP): The patient has the disease, and the test is positive. The test correctly identified the disease.
- False Positive (FP): The patient does not have the disease, but the test is positive. This is a false alarm (Type I error).
- False Negative (FN): The patient has the disease, but the test is negative. The test missed the disease (Type II error).
- True Negative (TN): The patient does not have the disease, and the test is negative. The test correctly ruled out the disease.
With this framework, we can now define the key metrics of test performance.
2. Intrinsic Test Characteristics: Sensitivity and Specificity
Sensitivity and specificity are characteristics inherent to the test itself. They tell us how well the test performs under ideal conditions and are not affected by how common the disease is in a population.
Sensitivity
Sensitivity measures how well a test can detect the disease when it is actually present.
- The Clinical Question: "Of all the people who genuinely have this disease, what percentage will test positive?"
- Calculation:
A test with high sensitivity is very good at identifying people with the disease. It has very few false negatives.
Specificity
Specificity measures how well a test can rule out the disease when it is truly absent.
- The Clinical Question: "Of all the people who are healthy, what percentage will test negative?"
- Calculation:
A test with high specificity is very good at confirming the absence of disease. It has very few false positives.
Applying Sensitivity and Specificity in Clinic: SnNOut and SpPIn
These concepts lead to two extremely useful clinical mnemonics:
-
SnNOut: A test with high Sensitivity, when Negative, helps to rule Out the disease.
- Why? A highly sensitive test rarely misses the disease (it has few false negatives). So, if you get a negative result from a highly sensitive test, you can be quite confident the patient doesn't have the disease. These are great screening tests.
- Example: The D-dimer test for pulmonary embolism is highly sensitive. A negative result makes a PE very unlikely.
-
SpPIn: A test with high Specificity, when Positive, helps to rule In the disease.
- Why? A highly specific test rarely gives a positive result for a healthy person (it has few false positives). So, if you get a positive result from a highly specific test, it's very likely the patient actually has the disease. These are great confirmatory tests.
- Example: A positive urine culture for a specific bacterium is highly specific for a UTI caused by that organism.
To see these calculations and mnemonics in action, let's return to the video.
Clinical Reasoning 6: Sensitivity, Specificity & Predictive Values
This segment of the video demonstrates how to calculate sensitivity and specificity and introduces the essential 'SnNOut' and 'SpPIn' mnemonics.
Please watch from 3:37 to 4:53, and then from 8:26 to 9:30. Pay close attention to which part of the 2x2 table is used for each calculation.
Test your understanding!
A new rapid test for Strep throat is studied in 200 patients with a sore throat. A throat culture (the gold standard) confirms that 100 of them have Strep throat. The new rapid test is positive in 80 of the patients with Strep and 10 of the patients without Strep.
- What is the sensitivity of the rapid test?
- What is the specificity of the rapid test?
- Is this test better for ruling in or ruling out the disease?
Show answer
First, let's build the 2x2 table:
- Total patients = 200
- Have Strep (Disease +) = 100
- Don't have Strep (Disease -) = 100
- True Positives (TP): Have Strep and test positive = 80
- False Negatives (FN): Have Strep and test negative = 100 - 80 = 20
- False Positives (FP): Don't have Strep but test positive = 10
- True Negatives (TN): Don't have Strep and test negative = 100 - 10 = 90
- Sensitivity = TP / (TP + FN) = 80 / (80 + 20) = 80 / 100 = 80%
- Specificity = TN / (TN + FP) = 90 / (90 + 10) = 90 / 100 = 90%
- With a specificity of 90%, it is reasonably good at ruling in the disease (SpPIn). A positive result makes the diagnosis of Strep throat quite likely. Its sensitivity is lower, meaning it will miss 20% of cases (a negative result doesn't confidently rule it out).
3. Clinician-Focused Metrics: Predictive Values
While sensitivity and specificity describe the test, they don't directly answer the question you have when you see a patient: "Given this patient's positive (or negative) result, what is the probability they actually have the disease?"
This is where predictive values come in.
Positive Predictive Value (PPV)
PPV tells you the probability that a patient with a positive test result actually has the disease.
- The Clinical Question: "My patient's test is positive. What's the chance they are actually sick?"
- Calculation:
Negative Predictive Value (NPV)
NPV tells you the probability that a patient with a negative test result is actually healthy.
- The Clinical Question: "My patient's test is negative. What's the chance they are actually healthy?"
- Calculation:
The Crucial Role of Prevalence
Here is the single most important clinical pearl of this lesson: Predictive values (PPV and NPV) are NOT fixed properties of a test. They are heavily influenced by the prevalence of the disease in the population you are testing.
- Prevalence: The proportion of people in a population who have the disease at a specific time.
In a setting where the disease is common (high prevalence), a positive test is more likely to be a true positive, leading to a higher PPV. Conversely, in a setting where the disease is rare (low prevalence), a positive test is more likely to be a false positive, leading to a lower PPV.
This is why the same test can be very useful in a specialist clinic but almost useless as a general screening tool. The following video explains this concept perfectly.
Positive Predictive Value & Disease Prevalence
This Medmastery video clearly demonstrates why you, as a clinician, must always consider the patient population when interpreting a test result. It shows how disease prevalence dramatically changes a test's predictive value.
Please watch the entire video (4 minutes, 38 seconds). Pay special attention to the example where the prevalence is changed from 5% to 20% and see how that impacts the PPV, even though the test's sensitivity and specificity remain the same.
Synthesis: Applying These Concepts to a Real Test
Let's tie everything together using a common clinical scenario: using B-type Natriuretic Peptide (BNP) to diagnose congestive heart failure (CHF) in a patient with shortness of breath.
The following resource walks through a study of BNP, builds the 2x2 table, and calculates all four metrics we've discussed. It also demonstrates the powerful effect of changing disease prevalence on the test's predictive values.
Sensitivity, Specificity, and Predictive Values in Diagnostic Testing
This material from the ADLM's 'Pearls of Laboratory Medicine' provides an excellent, real-world application of today's concepts using the BNP test for heart failure.
Please read the content from 'Slide 4' through 'Slide 14'. Focus on how the 2x2 table is constructed from the study data (Slide 8), how sensitivity, specificity, PPV, and NPV are calculated (Slides 9-11), and the impact of changing prevalence on the predictive values (Slides 13-14).
This example solidifies the idea that sensitivity and specificity tell you about the test's quality, while predictive values—influenced by prevalence—tell you how to apply it to your patient.
Key Takeaways
This lesson covered the fundamental principles of evaluating a diagnostic test. Here are the main points to remember:
- The 2x2 Table is the standard tool for organizing test outcomes (TP, FP, FN, TN).
- Sensitivity and Specificity are intrinsic properties of a test that measure its ability to correctly identify those with and without the disease, respectively.
- The SnNOut and SpPIn mnemonics are practical tools for using sensitive tests to rule out disease and specific tests to rule it in.
- PPV and NPV are the metrics you use at the bedside to determine the probability of disease given a test result.
- Crucially, PPV and NPV are dependent on the prevalence of the disease in your patient population. Always consider your clinical context.
Next Steps
Now that you have a solid grasp of how to evaluate a test's performance characteristics, our next lesson will address the next logical question: when you see a lab report with a number flagged as "high" or "low," what does that actually mean? We will explore how reference ranges are established and, more importantly, how to distinguish between a result that is merely statistically abnormal and one that is truly clinically significant for your patient.