Hello! Welcome to the final lesson of our module on Thyroid Function and the Lipid Panel.
In our previous lesson, we completed our study of the thyroid by learning how to interpret thyroid antibodies to diagnose autoimmune conditions like Hashimoto's and Graves' disease. We saw how specific antibodies (TPOAb and TRAb) help pinpoint the underlying cause of abnormal thyroid function tests.
Today, we shift our focus from the endocrine system to cardiovascular health. This lesson will teach you how to interpret the standard lipid panel—total cholesterol, LDL, HDL, and triglycerides—in the context of cardiovascular risk assessment. As you've likely seen on your clinical rotations, this is one of the most common and important laboratory panels used in both primary and preventative care. Our goal is to move beyond simply labeling values as "high" or "low" and instead learn how to use them to make meaningful clinical judgments about a patient's risk for heart disease and stroke.
1. The Lipid Panel: Why We Measure It
Lipids, such as cholesterol and triglycerides, are essential for many bodily functions, but high levels of certain types in the blood are a primary driver of atherosclerosis. This is the process where fatty plaques build up in the walls of arteries, leading to narrowing, blockages, and ultimately, events like myocardial infarction (heart attack) and cerebrovascular accident (stroke).
The lipid panel is a blood test that measures the concentration of these lipids, which are transported in the blood via particles called lipoproteins.
How to read a lipid panel with Dr. Thomas Dayspring
To begin, let's watch a short introduction from lipidologist Dr. Thomas Dayspring. He explains the basic link between lipids and atherosclerosis and introduces the components of a standard lipid panel.
Watch the two short clips from 00:48 to 02:07 and from 04:34 to 05:18. This will provide a concise overview of why we test for lipids and which tests are included in the panel.
As the video outlined, a standard lipid panel includes:
- Total Cholesterol (TC)
- Low-Density Lipoprotein Cholesterol (LDL-C)
- High-Density Lipoprotein Cholesterol (HDL-C)
- Triglycerides (TG)
- Non-HDL Cholesterol (Non-HDL-C) (This is calculated, not directly measured, but is critically important)
Here is an example of what a lipid panel report might look like:

2. Interpreting the Individual Components
Let's break down each component and its clinical significance. While guidelines provide specific numerical targets, it's crucial to understand the role each lipid plays.
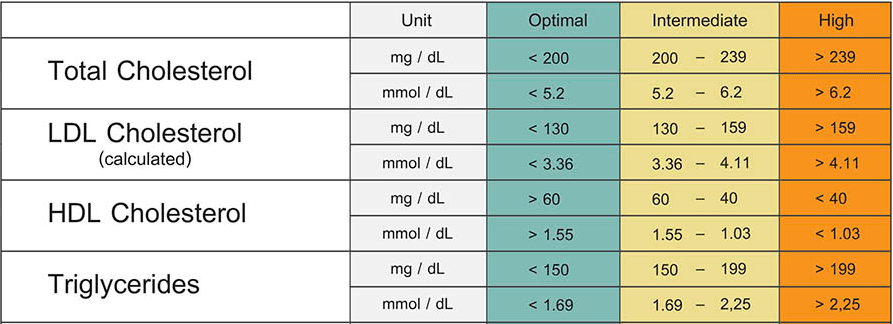
To add expert context to these numbers, let's turn back to Dr. Dayspring, who provides a more nuanced view of each component.
How to read a lipid panel with Dr. Thomas Dayspring
This video series provides a deep dive into each component of the lipid panel. Dr. Dayspring explains the role of each lipoprotein and offers clinical pearls on interpretation beyond just the reference ranges.
Watch the following segments to understand each component: LDL Cholesterol (The 'Bad' Cholesterol): 07:02 - 08:52 HDL Cholesterol (The 'Good' Cholesterol): 08:52 - 10:09 Triglycerides: 10:09 - 12:43 Non-HDL Cholesterol: 12:43 - 14:29 Pay close attention to his emphasis on LDL-C and Non-HDL-C as the primary drivers of risk.
Let's summarize the key takeaways for each component:
- Total Cholesterol (TC): A broad measure of all cholesterol in the blood. An elevated TC is a red flag, but it is less specific than its sub-components.
- LDL-C ("Bad" Cholesterol): This is the primary driver of atherosclerosis. LDL particles deliver cholesterol to the artery wall. Lowering LDL-C is the main goal of most lipid-lowering therapies.
- HDL-C ("Good" Cholesterol): HDL particles are involved in "reverse cholesterol transport," removing cholesterol from the artery wall and transporting it back to the liver. Low HDL-C is a significant risk factor.
- Triglycerides (TG): High levels are an independent risk factor for cardiovascular disease. They are often elevated in patients with obesity, metabolic syndrome, and uncontrolled diabetes. Very high levels (>500 mg/dL or ~5.6 mmol/L) also increase the risk of acute pancreatitis.
- Non-HDL-C: This is calculated as Total Cholesterol - HDL-C. It represents the cholesterol content of all atherogenic (plaque-forming) particles, including LDL, VLDL, and others. It is an excellent measure of overall cardiovascular risk, especially in patients with high triglycerides.
3. The Core of Interpretation: Cardiovascular Risk Assessment
Interpreting a lipid panel is not done in a vacuum. The numbers are only meaningful when placed in the context of the patient's overall risk for developing Atherosclerotic Cardiovascular Disease (ASCVD).
The fundamental question we ask is: What is this patient's risk of having a heart attack or stroke in the next 10 years, and can we reduce that risk?
Primary vs. Secondary Prevention
First, you must determine if you are dealing with primary or secondary prevention.
- Secondary Prevention: The patient has already been diagnosed with ASCVD (e.g., has a history of myocardial infarction, coronary stenting, stroke, or peripheral artery disease). In these patients, the goal is aggressive risk reduction to prevent a second event. They are almost always treated with high-intensity statin therapy, regardless of their baseline lipid levels.
- Primary Prevention: The patient has no known ASCVD. Here, the goal is to prevent a first event. The decision to treat is based on a formal risk assessment.
Risk Stratification in Primary Prevention
For primary prevention, you don't treat a number; you treat a patient's overall risk. This is done using a risk calculator. In the US, the most common tool is the ACC/AHA ASCVD Risk Estimator. In the UK, the QRISK3 score is used.
These calculators integrate multiple factors to estimate a 10-year risk of an ASCVD event:
- Age, sex, race
- Total cholesterol and HDL-C
- Systolic blood pressure (and whether it's treated)
- History of diabetes
- Smoking status
The following case study demonstrates this process perfectly.
Lipid Management Case Study: Lab Interpretation for Nurse Practitioners
This video from Real World NP provides an excellent, practical walkthrough of how to approach a patient with an abnormal lipid panel. It emphasizes the importance of risk calculation over chasing individual numbers.
Watch these key segments to understand the clinical decision-making process: Framing the Problem (03:20 - 05:45): Understand why the focus is on ASCVD risk, not just lab values. Identifying Risk Factors (05:45 - 07:51): Learn the key clinical risk factors for ASCVD. Using the Risk Calculator (10:14 - 13:47): Watch a demonstration of how patient data is entered into the ASCVD risk calculator to guide treatment decisions.
As the video explains, the 10-year risk score places patients into categories that guide therapy:
- Low Risk (<5%): Lifestyle modification is the focus.
- Borderline Risk (5% to 7.4%): Emphasize lifestyle; consider medication if other risk-enhancing factors are present.
- Intermediate Risk (7.5% to 19.9%): Lifestyle changes are essential. Medication (typically a moderate-intensity statin) should be discussed and offered.
- High Risk (≥20%): Lifestyle changes and initiation of statin therapy are recommended to lower LDL-C significantly.
Additionally, some patients are automatically considered high-risk and candidates for statins without needing a risk score, such as most adults with diabetes or anyone with an LDL-C ≥190 mg/dL.
To solidify these concepts, please read this summary from Geeky Medics. It outlines the process of interpreting a lipid profile based on UK NICE guidelines, which use the QRISK3 calculator. The principles are the same and this will give you a well-rounded perspective.
Read the entire section titled 'Interpreting a lipid profile'. Focus on how the approach differs for 'Screening' (primary prevention), a 'Recent cardiovascular event' (secondary prevention), and 'Monitoring'.
Test your understanding!
A 58-year-old male comes to your clinic for a health check. He has no known heart disease.
- He smokes half a pack of cigarettes per day.
- His blood pressure is 142/88 mmHg and he is not on any medication for it.
- His lipid panel shows:
- Total Cholesterol: 225 mg/dL
- HDL-C: 38 mg/dL
- Triglycerides: 180 mg/dL
- LDL-C: 151 mg/dL
Based on this information, what are the key steps in your assessment and what would you generally recommend?
Show answer
-
Identify Risk Factors: This is a primary prevention scenario. The patient's ASCVD risk factors include:
- Age > 45 for males
- Current smoker
- Elevated blood pressure
- Dyslipidemia (high TC, high LDL-C, low HDL-C, high TG)
-
Determine Next Step: The absolute lipid values are abnormal, but the most important next step is to quantify his overall risk. You should use an ASCVD risk calculator (like the ACC/AHA tool) to estimate his 10-year risk of a heart attack or stroke.
-
Formulate a Recommendation (based on likely risk): Given his multiple risk factors, his 10-year risk will almost certainly be in the intermediate or high-risk category (likely >7.5%). Therefore, the recommendation would include:
- Intensive lifestyle counseling: Smoking cessation is paramount. Dietary changes and increased physical activity are also crucial.
- Initiation of pharmacotherapy: A discussion about starting a moderate-intensity statin would be appropriate to lower his LDL-C and reduce his overall risk.
Conclusion
You have now learned how to approach the lipid panel with a clinical mindset. It's a powerful tool, but its interpretation extends far beyond the numbers on the page. By integrating lipid values with a patient's complete clinical picture and using formal risk assessment tools, you can make evidence-based decisions to help prevent cardiovascular disease.
Key Takeaways:
- A lipid panel measures Total Cholesterol, HDL-C, LDL-C, and Triglycerides to assess cardiovascular risk.
- LDL-C is the primary driver of atherosclerosis and the main target of therapy. Non-HDL-C is an excellent secondary measure of all "bad" cholesterol.
- Interpretation depends on the clinical context: primary prevention (preventing a first event) versus secondary prevention (preventing a subsequent event).
- In primary prevention, the decision to start medication is based on a patient's calculated 10-year ASCVD risk, not just their lipid levels in isolation.
- Lifestyle modifications, especially smoking cessation, diet, and exercise, are a cornerstone of risk reduction for all patients.
Preview of the Next Lesson:
We've introduced the concept of Non-HDL Cholesterol today as a comprehensive marker of risk. In our next lesson, we will build directly on this foundation. You will learn how to calculate and interpret non-HDL cholesterol as a secondary target in cardiovascular risk management. We will explore why it is particularly useful in patients with diabetes and high triglycerides and how it can help refine your treatment goals.