Welcome to the penultimate lesson of our course. Last time, we crafted a formal experimental protocol, which serves as the blueprint for your computational study. You now know how to select benchmarks, choose comparison algorithms, and design a fair parameter tuning strategy. The next logical step, after running those experiments, is to analyze and present your findings.
This lesson addresses the learning outcome: Interpret and report experimental results following academic research standards. This is where your hard work translates into a compelling narrative that forms the core of your thesis's contribution. We'll explore how to move from raw data to insightful conclusions, creating the Results and Discussion chapters of your thesis.
Specifically, we will cover:
- Structuring the Results Section: How to present your data objectively using tables and visualizations.
- Structuring the Discussion Section: How to interpret your findings, argue for their significance, and situate them within the broader research landscape.
- Using Statistical Analysis: How to use statistical tests to add rigor to your claims and prove that your results are meaningful.
1. The Results vs. The Discussion: What vs. So What?
A common mistake in academic writing is to blur the lines between the Results and Discussion sections. They serve two distinct purposes:
- The Results section objectively reports what you found. It presents the data without interpretation or speculation.
- The Discussion section interprets what those results mean. It explains the "so what" of your findings, connecting them back to your research questions and the existing literature.
Let's start by looking at best practices for the Results section.
How to Write a Dissertation Results Section | Scribbr 🎓
The video 'How to Write a Dissertation Results Section' from Scribbr provides a concise overview of how to structure this chapter. It clearly explains the principle of objective reporting.
Please watch the video from the beginning until 03:26. Pay close attention to the advice on structuring the section around research questions or hypotheses, what to include (descriptive/inferential stats), and the importance of using the past tense.
2. Presenting Your Data: Tables and Visualizations
As the video highlighted, the Results section should present your findings in a logical order, using tables and figures to make the data easy to understand. Your goal is clarity and objectivity.
2.1. The Power of a Good Table
Tables are essential for presenting detailed numerical comparisons between algorithms. A well-designed table allows the reader to quickly assess the performance of different methods across various benchmark instances.
Key features of a strong results table:
- Clear headings for columns (Instance, Size, Metrics like Makespan or RPD, CPU time).
- Comparison of multiple algorithms, including your proposed method, SOTA algorithms, and baselines.
- Highlighting the best results for each instance (e.g., using bold text) to immediately draw the reader's attention.
- Averages or summaries at the bottom to provide an overall picture.
Dynamic Flexible Job Shop Scheduling via an Adaptive ...
The paper 'Dynamic Flexible Job Shop Scheduling via an Adaptive ...' contains excellent examples of modern, clear results tables. Let's examine one.
Please find and read Section 5.4, 'Algorithm Comparison and Analysis'. Focus on Table 9. Notice how it compares the proposed algorithm (MyQNGA) against four others on multiple instances. It reports the mean makespan and standard deviation from 30 runs, and uses bolding to highlight the best result for each instance. It also includes p-values, which we will discuss shortly.
2.2. Telling a Story with Visualizations
While tables provide the details, figures and charts tell a story visually. In scheduling research, three types of visualizations are particularly powerful.
- Gantt Charts: These provide a concrete visualization of a single schedule. They are excellent for illustrating how a specific solution works, showing machine utilization and the flow of jobs over time.

*This Gantt chart shows a schedule for a specific problem instance. Each colored block is an operation on a machine. This visualization makes it easy to see the makespan (the total time), idle times on machines, and the sequence of operations.*
2. Convergence Curves: For iterative algorithms like metaheuristics, a convergence curve shows how the solution quality (e.g., makespan) improves over generations or time. They are perfect for comparing how quickly different algorithms find good solutions.
- Box Plots: Since metaheuristics are stochastic, running an algorithm once isn't enough. You'll run it multiple times (e.g., 30 times) to get a distribution of results. A box plot is the standard way to visualize this distribution, showing the median, quartiles, and range of outcomes. It's a powerful tool for demonstrating the stability and consistency of your algorithm.
Dynamic Flexible Job Shop Scheduling via an Adaptive ...
Let's return to the 'MyQNGA' paper to see examples of convergence curves and box plots.
Please look at Figure 4 in Section 5.3. This is a box plot comparing the makespan distributions of different strategies. Then, look at Figure 5 in Section 5.4. This is a convergence curve comparing MyQNGA and a baseline, showing that MyQNGA finds better solutions faster. Note how the caption explains what each figure depicts.
3. Interpreting Your Findings: The Discussion Section
Once you've presented your results, it's time to interpret them. The Discussion section is where you build your argument, explain the significance of your findings, and demonstrate critical thinking.
A good structure for this section is crucial.
How To Write The Discussion Section For Your Research Paper (DETAILED GUIDE)
Professor David Stuckler's video 'How To Write The Discussion Section' offers an excellent, systematic outline for structuring this part of your thesis. This will serve as our roadmap.
Please watch the video from 01:38 to 12:22. The presenter outlines a clear structure: Recap main findings. Acknowledge limitations. Highlight strengths/contributions. Discuss coherence with existing literature. Suggest implications for future research and practice. He then provides a concrete before-and-after example.
3.1. Proving It's Not Luck: Statistical Significance
One of the most important parts of interpreting results is demonstrating that the differences you observe are statistically significant and not just a result of random chance. For example, if your algorithm's average makespan is 150 and a competitor's is 152, can you confidently claim yours is better? This is where statistical hypothesis testing comes in.
Given your background in industrial engineering, you are likely familiar with statistical methods like Analysis of Variance (ANOVA) and t-tests. These are the standard tools used in scheduling research to compare algorithmic performance.
- ANOVA is used to compare the means of three or more groups (e.g., your algorithm vs. two SOTA algorithms). It tells you if there is a statistically significant difference somewhere among the algorithms.
- A paired t-test is often used to compare the means of two groups (e.g., your algorithm vs. one competitor across multiple instances).
The key output of these tests is the p-value. A common threshold is p < 0.05, which suggests there is less than a 5% probability that the observed difference is due to random chance.
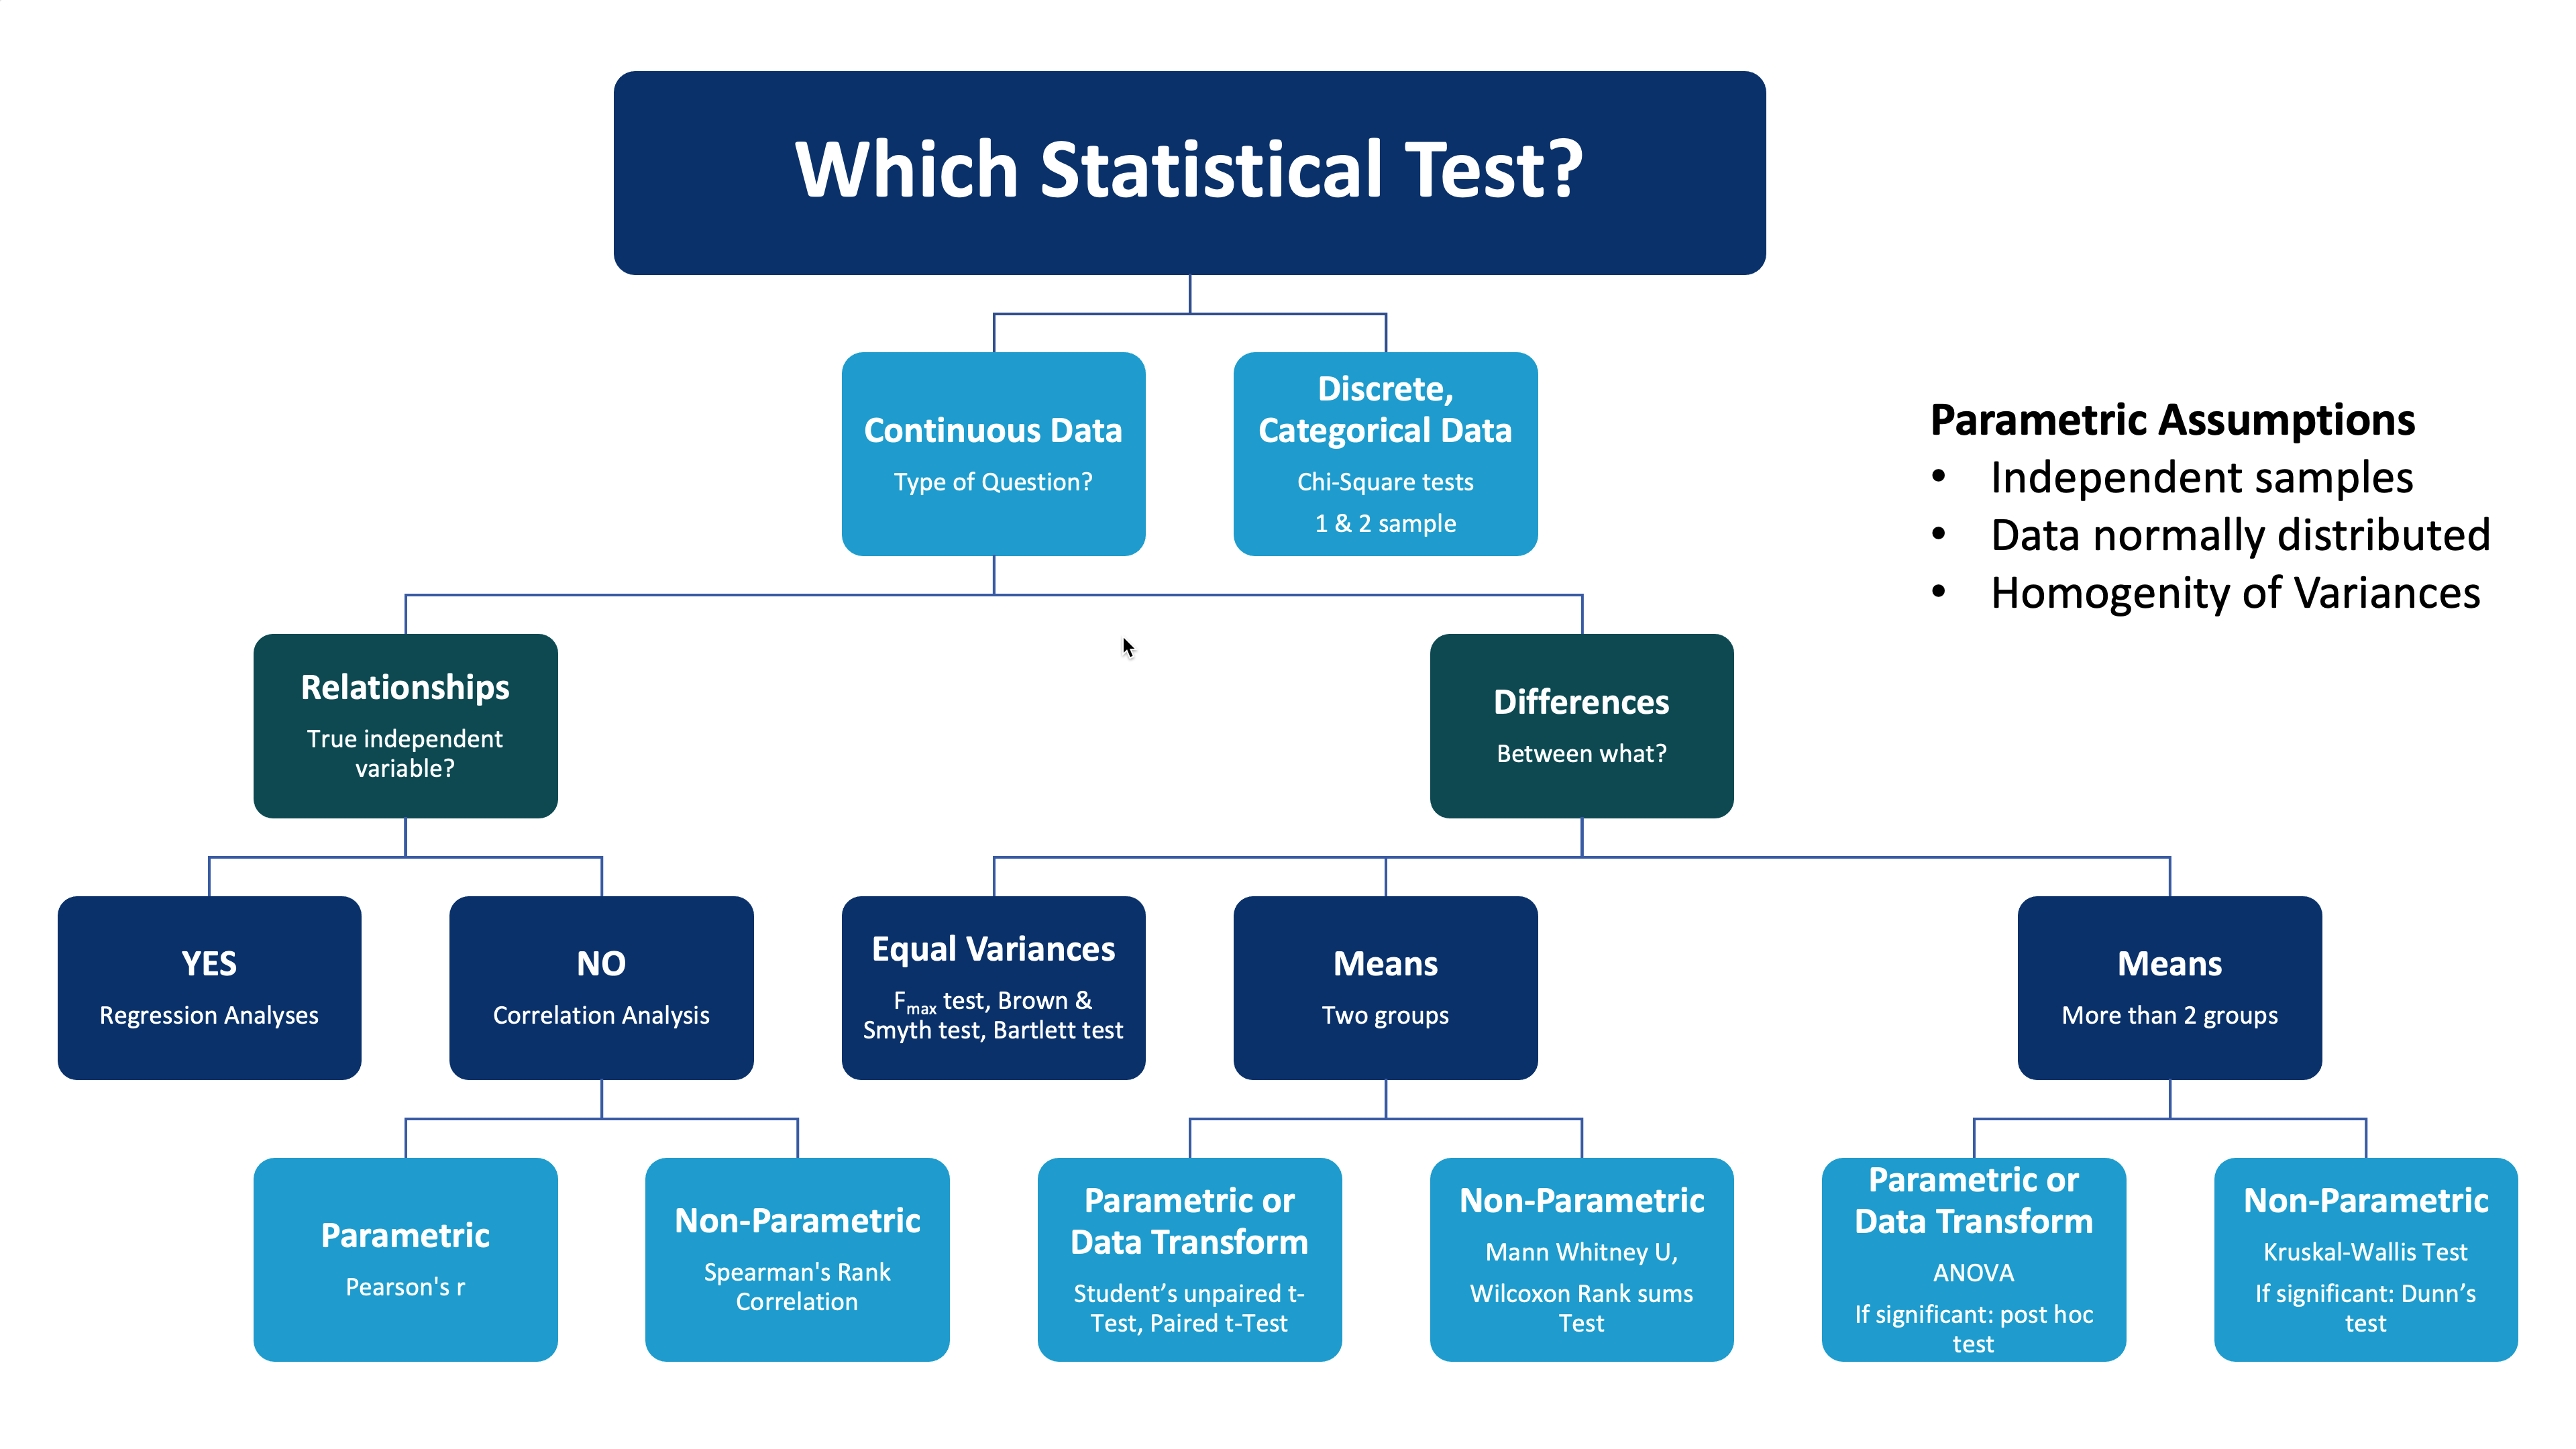
This flowchart provides a general guide for selecting an appropriate statistical test based on your data and research question. For comparing algorithm performance (a continuous metric like makespan), you will typically use tests for comparing means, such as ANOVA or t-tests.
Let's look at a detailed example of ANOVA being used in a PhD thesis—a perfect model for your own work.
optimizing the flexible job-shop scheduling problem using ...
The PhD thesis by Al-Hinai provides an in-depth example of using ANOVA to analyze experimental results for the FJSP. This is a rigorous approach that will be very suitable for your thesis.
Please read the section '3.5.1.1 Analysis of robustness and stability measures' (pages 82-86). Don't worry about understanding every detail of the problem itself. Instead, focus on how the author uses ANOVA: He defines a performance measure, RQULT (Eq. 3.13). He runs experiments with different factors (Measure, Test case, Breakdown Type). He presents the ANOVA results in Table 3.2, showing the F-ratio and P-value for each factor. He interprets the results, stating: 'effects are considered significant if the P-value is less than 0.05'. He uses the F-ratio to identify the most influential factor. He uses plots (Figures 3.3 and 3.4) to visualize the significant interactions and draw conclusions.
By performing and reporting a statistical analysis like this, you elevate your claims from simple observation ("my algorithm looks better") to a scientifically defensible conclusion ("my algorithm is statistically significantly better").
3.2. Building Your Argument
With your statistically validated results, you can now follow the structure outlined in Prof. Stuckler's video to write your Discussion chapter.
- Recap findings: "The results in Table 9 show that our proposed algorithm, MyQNGA, achieved an average makespan improvement of 4.5% over the QNGA baseline, and this improvement was found to be statistically significant (p < 0.001) across all benchmark sets."
- Discuss coherence with literature: "This finding supports the hypothesis from [Author, Year] that integrating local search enhances exploration. However, it contrasts with the findings of [Another Author, Year], who found that... Our results suggest this discrepancy may be due to..."
- Discuss implications: "The superior performance of our method on large-scale problems with transport constraints suggests it could be a viable solution for automated scheduling in real-world automated warehouses..."
- Acknowledge limitations: "A limitation of this study is that we did not consider machine breakdowns. The robustness of the proposed schedule under such disruptions is a key area for future work."
- Future research: "Future work should extend the model to include energy consumption as a second objective and explore the use of a CP-based local search for more intensive optimization."
Test your understanding!
Imagine you have run your experiments and your new algorithm (MyAlgo) consistently achieves a slightly lower average makespan than the state-of-the-art (SOTA_Algo) across 10 benchmark instances. You perform a paired t-test on the results and get a p-value of 0.21.
How should you report this finding in your discussion?
Show answer
You should report the finding honestly and accurately. A p-value of 0.21 is greater than the standard 0.05 threshold, meaning the difference is not statistically significant.
A good way to phrase this would be: "While MyAlgo achieved a slightly lower average makespan than SOTA_Algo across the benchmark set, this difference was not found to be statistically significant (p = 0.21). This suggests that, based on our experiments, MyAlgo performs comparably to the current state-of-the-art, but does not offer a decisive performance advantage in terms of makespan alone. However, MyAlgo demonstrated a 30% reduction in average computation time, suggesting its main contribution may be in computational efficiency."
This shows that you understand statistical principles and can interpret your results critically, even when they don't show overwhelming superiority.
Conclusion
You now have a comprehensive framework for turning your experimental data into the results and discussion chapters of your thesis. Remember that these chapters work together to make the case for your research contribution.
Key Takeaways:
- Separate Results and Discussion: The Results section objectively presents data (the "what"), while the Discussion section interprets its meaning (the "so what").
- Use Clear Visuals: Employ well-structured tables, Gantt charts, convergence curves, and box plots to present your data effectively.
- Validate with Statistics: Use statistical tests like ANOVA or t-tests to prove your claims of algorithmic superiority are statistically significant. A low p-value (e.g., < 0.05) is your evidence.
- Structure Your Discussion: Follow a logical flow: recap your findings, acknowledge limitations, highlight strengths, compare with existing work, and propose future research directions.
Preview of the Next Lesson:
We have now covered all the major steps of conducting and reporting research. In our final lesson, we will synthesize everything you've learned. The goal will be to "Articulate a clear and defensible thesis contribution statement that addresses an identified research gap." This will be the capstone of our course, helping you to define and frame the core message of your entire thesis.