Introduction
In our previous lesson, we established a powerful framework for modeling the tail of a loss distribution: the Peaks-Over-Threshold (POT) method, which leads to the Generalized Pareto Distribution (GPD). We saw how to select an appropriate threshold using a mean excess plot and then fit the GPD parameters and to the resulting excess losses.
This lesson brings that work to its practical conclusion. After all, the primary goal of modeling extremes is to quantify risk. We will now learn how to use our fitted extreme value models—both the GPD from the POT approach and the GEV from the block maxima method—to estimate critical risk measures. Specifically, we will focus on calculating high quantiles, known as Value-at-Risk (VaR), and the subsequent tail expectation, the Expected Shortfall (ES). Mastering this step will allow you to answer crucial business questions, such as "What is our estimated loss for a 1-in-200 year event?" and "If such an event occurs, what is our expected loss?".
From a Fitted GPD to VaR and ES
The POT approach gives us a model (the GPD) for the behavior of losses conditional on them exceeding the threshold . To calculate a risk measure like VaR for the entire loss distribution, we need to combine this conditional tail model with information about the probability of exceeding the threshold in the first place.

Calculating VaR and ES with GPD Parameters
The probability of exceeding the threshold, , can be estimated empirically from the data as , where is the number of observations exceeding and is the total number of observations. The GPD, with its fitted parameters and , models the distribution of the excesses . By combining these two pieces, we can derive a formula for any high quantile of the original distribution.
The following resource provides the explicit formulas for VaR and ES, along with a clear, practical example. As a statistician, you'll appreciate how the formula logically combines the threshold value with a scaled term derived from the GPD's inverse CDF.
Parametric Approaches (II): Extreme Value - AnalystPrep
This section from AnalystPrep provides the explicit formulas and a worked example for calculating VaR and Expected Shortfall from a fitted POT model.
Focus on the formulas for VaR and Expected Shortfall. Then, carefully work through the full example to see how these formulas are applied with given parameters.
A Deeper Look at the Theory and Uncertainty
The formulas are direct, but it's crucial to understand their origin and, more importantly, the uncertainty surrounding their outputs. The video below walks through the derivation of the VaR and ES formulas from the GPD and applies them to the Danish fire insurance data we analyzed in the previous lesson. A key insight here is the discussion of the confidence intervals.
Extreme value theory (QRM Chapter 5)
Now that you have the formulas, let's watch a segment from the QRM Tutorial that provides a deeper discussion.
Watch the entire segment from this point. Pay close attention to: How the tail probability \overline{F}(x) is constructed from the GPD. The derivation of the VaR and ES formulas. The discussion of the massive uncertainty in the ES estimate, illustrated by the very wide confidence interval (from 40 to 155 million). This is a critical practical takeaway in risk management.
The video's final point cannot be overstated. While EVT gives us the tools to extrapolate into the far tail, the statistical uncertainty of these estimates grows immensely as we do so. A point estimate of VaR or ES is almost meaningless without an accompanying confidence interval.
Self-Assessment
To solidify your understanding, please work through the following practice problem.
Parametric Approaches (II): Extreme Value - AnalystPrep
Let's test your understanding with a practice problem.
Read and solve Question 1. Try to calculate the VaR and ES yourself using the formulas you've just learned before checking the provided solution.
Quantiles from the Block Maxima (GEV) Method
We can also estimate extreme quantiles using the GEV distribution fitted via the block maxima method. However, the interpretation is slightly different.
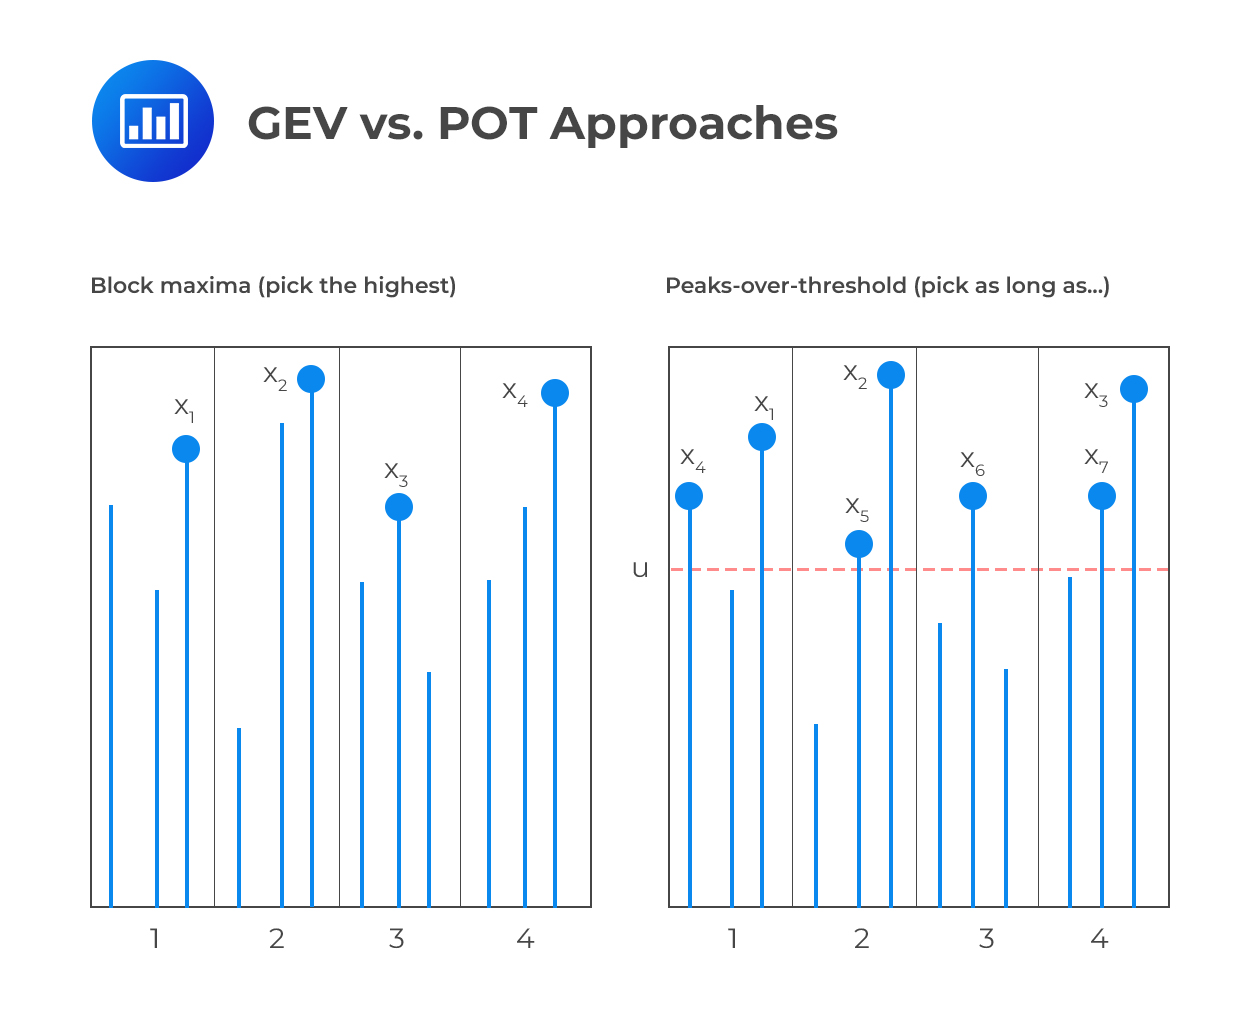
When we calculate a quantile from a fitted GEV distribution, we are finding a return level. A -block return level is the value that is expected to be exceeded by the maximum of a block once every blocks. For example, if we used yearly blocks, the 100-year return level is the loss that the annual maximum loss is expected to exceed, on average, once every 100 years.
The resource below details this concept and shows how to calculate these return levels from a fitted GEV model.
M6 Extreme Value Theory - General Insurance Modelling - AM3
This resource explains how to calculate high quantiles, often called "return levels," from a fitted GEV model.
First, read the section Quantiles. This introduces the concept of a t-year event and provides the key formulas for the t-year return level, u_t. Next, move to the Case study - quantiles section. Study the tables showing the comparison between empirical block maxima quantiles and the theoretical ones calculated from the fitted GEV model. Finally, look at the output from the return.level function, which shows how this is done in practice, complete with confidence intervals.
While the return level is a useful measure, it is a quantile of the distribution of maxima, not of the original "parent" loss distribution. For a direct comparison with the VaR from the POT method, we need a formula that relates the GEV parameters to the quantiles of the parent distribution. The formula incorporates the block size to make this adjustment.
Parametric Approaches (II): Extreme Value - AnalystPrep
While the GEV models the distribution of maxima, we can derive a formula to estimate the VaR of the underlying parent distribution.
Focus on the section Gumbel and Fréchet VaR. Study the formulas and then work through Example 3 (Gumbel VaR) and Example 4 (Fréchet VaR) to see them in action. Note the crucial role of the block size n in the formula.
In practice, the POT/GPD approach is generally preferred for estimating VaR and ES because it uses data more efficiently and directly models the tail of the loss distribution.
Conclusion
This lesson concludes our exploration of Extreme Value Theory by demonstrating its ultimate purpose in risk management: the quantification of extreme events. We have connected the theoretical models (GEV and GPD) to the practical calculation of VaR and ES, the cornerstone metrics for capital adequacy and risk appetite.
Key Takeaways:
- VaR and ES from GPD: Using the fitted parameters (), the threshold , and the empirical probability of exceeding the threshold , we can calculate VaR and ES for any high confidence level.
- Return Levels from GEV: The GEV distribution allows us to calculate -block return levels, which are quantiles of the distribution of block maxima. With an adjustment for block size, these can also be used to estimate the VaR of the underlying loss distribution.
- Uncertainty is Paramount: Estimates of extreme quantiles are subject to significant statistical uncertainty, which increases dramatically as we extrapolate further into the tail. Reporting a confidence interval is just as important as reporting the point estimate itself.
- POT vs. Block Maxima: For VaR and ES estimation, the POT approach is generally more efficient and direct, as it focuses on the distribution of all large losses rather than just the single largest loss in a period.
Preview of the Next Lesson
We have now completed our study of modeling individual risk factors, from their central tendency to their extreme tails. However, in most real-world portfolios, risks do not exist in isolation; they are interconnected. In our next module, we will turn our attention to dependence modeling. We will be introduced to copulas, a powerful statistical tool for describing and modeling the dependence structure between multiple random variables, independent of their individual marginal distributions.