Welcome to the next lesson in our exploration of Excel's advanced analysis tools. In our previous lessons, we focused on "what-if" analysis, using Goal Seek and Scenario Manager to explore outcomes based on different assumptions. We asked questions like, "What would our profit be if costs increase by 10%?" Now, we will shift from assumption-based modeling to data-driven prediction.
This lesson will teach you how to use historical data to project future performance. Specifically, we will cover the FORECAST.LINEAR function. This is a fundamental skill in accounting for tasks like budgeting, financial planning, and estimating future revenues or expenses based on past trends.
From "What-If" to "What's Next": An Introduction to Linear Forecasting
In accounting and finance, we often need to predict future values to create budgets and strategic plans. One of the most straightforward ways to do this is by identifying a trend in our historical data and extending that trend into the future. This is the essence of linear forecasting.
Excel's FORECAST.LINEAR function automates this process. It performs a statistical calculation called linear regression to find the "line of best fit" for your historical data and then uses that line to predict a future value.
Let's begin by understanding the function and how it fits within Excel's suite of forecasting tools.
Excel FORECAST functions with formula examples
This article from Ablebits.com provides a great overview of Excel's forecasting functions. It's important to know that FORECAST.LINEAR is the modern replacement for an older function.
First, read the introductory sections, Excel forecasting functions and Excel FORECAST function. This will clarify the difference between the legacy FORECAST function and the modern FORECAST.LINEAR. Next, read the section on the FORECAST.LINEAR function. Notice that the syntax is identical to the older function.
The key takeaway is that while you might see the older FORECAST function in legacy spreadsheets, you should always use FORECAST.LINEAR in modern versions of Excel.
Understanding the FORECAST.LINEAR Syntax
The function is powerful yet simple to use once you understand its three arguments. As you've just read, the syntax is:
=FORECAST.LINEAR(x, known_y's, known_x's)
Let's break down each component, as this is crucial for using the function correctly.
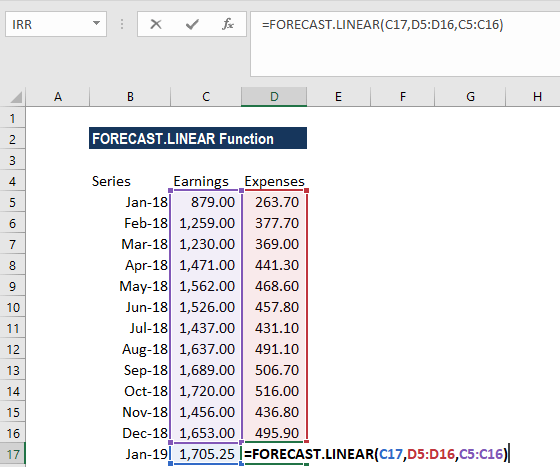
x(Required): This is the new, independent data point for which you want to predict a value. If your historical data is monthly sales, thexwould be the future month you are forecasting for.known_y's(Required): This is the range or array of your historical dependent data. These are the values you are trying to predict, such as past sales figures or expenses. In the equation of a line, , this is your 'y' variable.known_x's(Required): This is the range or array of your historical independent data. These are the values that correspond to yourknown_y's, such as a series of dates or time periods. This is your 'x' variable.
It is critical that the known_y's and known_x's ranges are the same size.
The following image provides an excellent visual of how these arguments map to a typical spreadsheet layout.
Putting it into Practice
Now, let's see the function in action. The following short video demonstrates how to enter the formula and, importantly, how to use absolute references to correctly copy it down for multiple future periods. This technique should be familiar from our first module.
Forecasting in Excel: MUST-KNOW for Any Analyst
This clip from Kenji Explains shows a very quick and clear example of applying the FORECAST.LINEAR function.
Watch the segment from this point. Pay close attention to how the F4 key is used to lock the known_y's and known_x's ranges. This ensures that when the formula is dragged down, it always refers to the complete set of historical data.
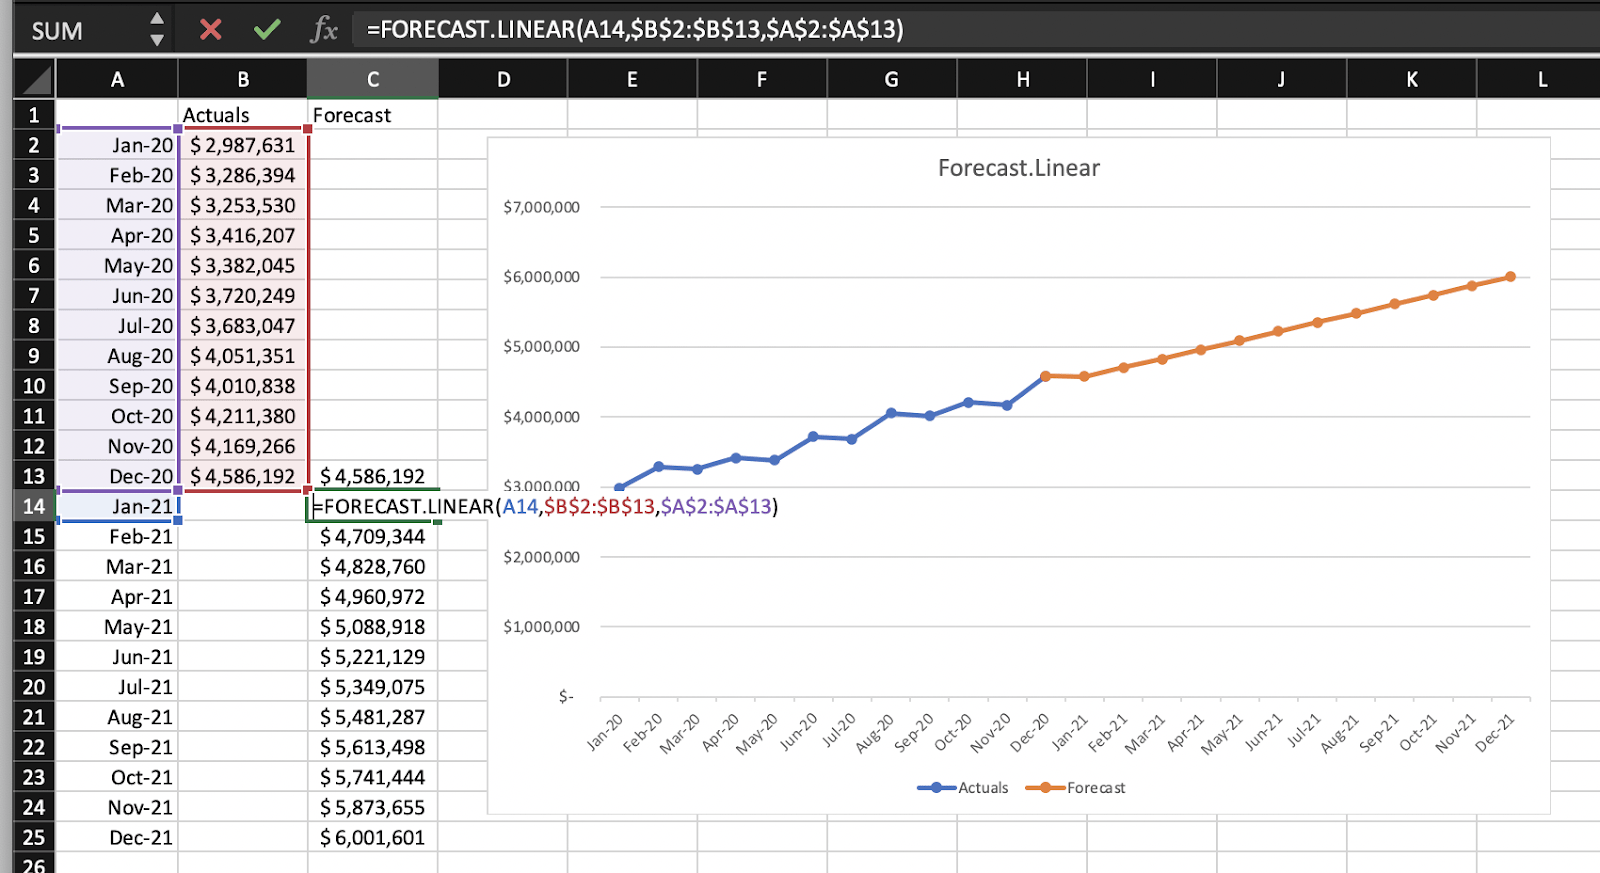
As the video shows, locking the historical data ranges ($B$2:$B$13 and $A$2:$A$13 in the example) is essential. The x argument (the future date) should remain a relative reference so that it updates as you copy the formula down to subsequent rows.
The result is a seamless projection of future values based on the past trend, which can be visualized effectively with a chart.
Acknowledging the Limitations
While FORECAST.LINEAR is an excellent tool, it's crucial to understand its primary limitation: it assumes the trend is, as the name suggests, linear. It projects a straight line and cannot account for more complex patterns, such as seasonality (e.g., higher sales in Q4 every year).
Using a linear forecast for seasonal data can be misleading. This next video explains this limitation and shows a visual comparison.
FORECAST.LINEAR & FORECAST.ETS Functions in Excel 2016
This video from Chester Tugwell provides a great visual for the concept of a trendline and explains the key limitation of linear forecasting.
First, watch the demonstration of how the function's output matches a trendline on a graph. This visually confirms what the function is calculating. Next, watch the important explanation of the function's limitation regarding seasonality.
For a professional accountant, knowing when not to use a tool is as important as knowing how to use it. If your data has a clear seasonal or cyclical pattern, FORECAST.LINEAR might not be the best choice. Excel offers more advanced functions like FORECAST.ETS to handle seasonality, but for now, mastering the linear forecast is our goal.
Conclusion
In this lesson, you have learned how to move from analyzing assumptions to making data-driven predictions using the FORECAST.LINEAR function. This is a practical and widely used technique for creating initial projections for budgets and financial plans.
Key Takeaways:
- The
FORECAST.LINEARfunction predicts a future value by extending a linear trend from historical data. - The syntax is
=FORECAST.LINEAR(x, known_y's, known_x's), whereyis the dependent variable (e.g., sales) andxis the independent variable (e.g., time). - When applying the formula for multiple periods, you must use absolute references for the
known_y'sandknown_x'sranges to keep them constant. - The function's main limitation is that it only works for linear trends and does not account for seasonality.
Now that we have covered tools for planning (Scenario Manager) and forecasting (FORECAST.LINEAR), a crucial next step in the accounting cycle is performance measurement. In our next lesson, we will learn how to perform budget vs. actual variance analysis to compare planned figures against actual results.