Welcome to our next lesson. In the previous session, we used FORECAST.LINEAR to project future financial figures, a key part of the planning and budgeting cycle. Now, we move to the next logical step: performance measurement. Once the accounting period is over, we need to compare our actual results against the budget we created.
This lesson will teach you how to perform budget versus actual variance analysis in Excel. You will learn to calculate both the absolute dollar variance and the relative percentage variance. For someone with your strong background in commerce, you already understand the "what" and "why" of variance analysis from a theoretical standpoint. Our goal today is to translate that theory into a practical and efficient Excel workflow, a fundamental skill for any accounting professional.
The Foundation of Performance Measurement
At its core, variance analysis is about measuring the difference between a planned figure (the budget) and the actual outcome. It's the primary tool for financial control, helping managers understand where the business is performing well and where it's deviating from the plan.
This analysis is typically broken down into two key metrics:
- Absolute Variance (or Dollar Variance): The simple monetary difference between the actual and budgeted amounts. It tells you the raw financial impact.
- Percentage Variance: The absolute variance expressed as a percentage of the budget. This is crucial for context, as it helps to gauge the significance of a variance relative to the planned amount.
Let's start with the basic definitions and formulas.
Budget vs Actual Variance: Analysis with Excel Formula
This article from Excel Insider provides a concise introduction to the concept and the core formulas.
Please read the first three short sections: The definition of variance and the meaning of favorable vs. unfavorable results. The formula for absolute variance. The formula for percentage variance and why it's useful.
Establishing a Clear Formula Convention
You might notice that different resources sometimes switch the order of subtraction (e.g., Actual - Budget vs. Budget - Budget). To maintain consistency and clarity, we will adopt the following convention which is common in financial analysis:
Dollar Variance = Actual Amount - Budget Amount
The interpretation of the result depends on the type of account:
- For Revenue accounts:
- A positive variance is Favorable (you earned more than budgeted).
- A negative variance is Unfavorable (you earned less than budgeted).
- For Expense accounts:
- A positive variance is Unfavorable (you spent more than budgeted).
- A negative variance is Favorable (you spent less than budgeted).
This clear distinction is vital for accurate reporting and analysis.
Calculating Variances in Excel
Let's see how to apply these formulas in a spreadsheet. This short video from Corporate Finance Academy provides a clear, practical demonstration.
Simple Variance Analysis - Variance to Budget & Variance to Prior Year
This video offers a straightforward walkthrough of calculating both dollar and percentage variances in Excel.
First, watch how to calculate the dollar variance using the Actual - Budget formula. Next, see how the percentage variance is derived from the dollar variance and the budget. Finally, listen to the important advice on why it's crucial to look at both dollars and percentages for a complete picture.
The key formulas are:
- Dollar Variance:
=C2-B2(where C2 is Actual and B2 is Budget) - Percentage Variance:
=D2/B2(where D2 is the calculated Dollar Variance and B2 is the Budget)
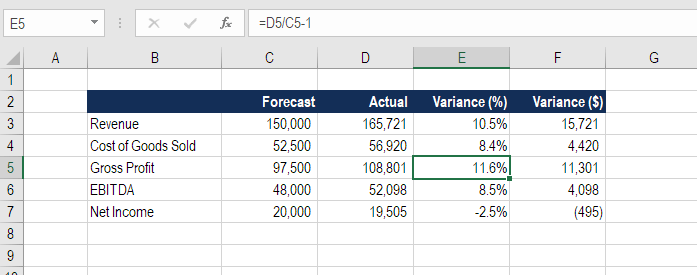
The image below shows a completed variance analysis report. Notice in the formula bar, the percentage variance for Gross Profit (cell E5) is calculated as =D5/C5-1. This is algebraically identical to (D5-C5)/C5, or (Actual - Budget)/Budget, reinforcing the formula we just learned.
A Deeper Dive: Contextual Variance Analysis for an Income Statement
Simple variance calculation is just the starting point. With your MCom background, you know that interpreting these numbers requires context. For example, if sales are 10% below budget, you would expect the Cost of Goods Sold to also be lower. But did costs decrease proportionally, or did margins erode?
To answer such questions, we can use a more advanced technique that analyzes each income statement line item as a percentage of net sales. This effectively creates a common-size income statement for both actual and budget figures, allowing you to analyze margin performance independent of sales volume fluctuations.
This next video provides an excellent, in-depth walkthrough of this method, which is highly relevant for management accounting.
Variance Analysis (vs budget and prior year)
This video from Learn Accounting Finance demonstrates a sophisticated method for variance analysis that explains the impact of each line item on your overall profit margins.
Step 1: Normalize by Sales. Watch how to calculate each income statement item as a percentage of net sales. This is a crucial first step to enable like-for-like comparison. Pay attention to the use of mixed cell references (freezing the row for Net Sales with F4) to make the formula copyable. Step 2: Calculate Margin Variances. Next, observe how to calculate the difference between the budget percentage and the actual percentage. The presenter cleverly uses the formula Budget % - Actual % for expenses (see here), so that a positive result always signifies a favorable variance (lower-than-budgeted cost ratio). Step 3: Dollarize the Impact. This is the most insightful part. Watch how these percentage-point variances are converted back into dollar impacts by multiplying them by the current year's actual net sales. This powerful step (watch here) quantifies exactly how much each line item contributed to the overall change in profit margin.
This method moves beyond simply stating that "Gross Profit was $11,301 over budget" to providing an explanation, such as "Our Gross Profit margin improved by 2.2%, driven by better-than-budgeted transportation costs, which contributed a favorable impact of $734,000." This level of analysis is what transforms a bookkeeper into a strategic financial partner.
Conclusion
In this lesson, you've bridged the gap between the accounting theory of variance analysis and its practical implementation in Excel. We've gone from basic calculations to a sophisticated method for providing deep, actionable insights into financial performance.
Key Takeaways:
- Variance analysis is the process of comparing actual results to a budget or other baseline.
- The standard formulas are Dollar Variance =
Actual - Budgetand Percentage Variance =Dollar Variance / Budget. - The interpretation of a variance (favorable or unfavorable) depends on whether you are analyzing a revenue or an expense account.
- Looking at both absolute ($) and relative (%) variances is essential for proper context.
- For advanced analysis of an income statement, calculating each item as a percentage of sales helps isolate margin performance from sales volume changes.
In our next lesson, we will continue our exploration of analytical models by learning how to build a model to conduct break-even analysis. This will help us determine the sales volume needed to cover all costs, another cornerstone of financial decision-making.