Welcome to the final lesson in our module on advanced financial analysis. In our previous session, we built a break-even model, a crucial tool for forward-looking business planning. Today, we shift our attention to monitoring current financial health by constructing one of the most vital reports for managing cash flow: the accounts receivable (AR) aging report.
Your background in commerce has certainly introduced you to the importance of managing receivables, assessing credit risk, and calculating the allowance for doubtful accounts. An AR aging report is the primary tool for these tasks. Our goal today is to bring that theory to life in Excel, building a dynamic and automated report that categorizes outstanding invoices by their age. This is a fundamental skill for anyone in an accounting or finance role.
The Purpose of an AR Aging Report
At its core, an AR aging report is a table that provides a detailed breakdown of a company's accounts receivable according to the length of time an invoice has been outstanding. It helps management understand the health of its receivables, identify late-paying customers, and focus collection efforts where they are most needed.
Doing accounts receivable aging reports in Excel
This article from the Journal of Accountancy provides a great overview of why AR aging reports are critical and how Excel can be used to create them.
Read the introductory paragraphs, starting from the beginning of the article. This will set the stage for the practical steps we are about to take.
Now, let's get building. We will transform a raw list of invoices into a fully functional and summarized aging report.
Step 1: Structure Your Data with an Excel Table
We'll start with a typical raw data export from an accounting system, which usually includes columns like Customer Name, Invoice Number, Due Date, and Invoice Amount.
The first and most important step towards automation is to structure this data as an Excel Table. As you learned in Module 3, tables provide dynamic ranges that automatically expand as you add new data, and formulas are automatically copied down. This eliminates common errors and saves significant time.
The video below demonstrates this initial setup.
Create an Accounts Receivable Aging Report in Excel
This video from HowtoExcel.net shows the best-practice first step for any dynamic report.
Watch the segment from the beginning where the presenter converts the raw data into a named Excel Table. Pay close attention to the reasons given for why this is so beneficial for automation.
Step 2: Calculate "Days Past Due"
With our table set up, our first calculation is to determine how many days each invoice is overdue. This requires a combination of a date function and a logical function.
- The
TODAY()function: This function is volatile, meaning it always returns the current date whenever the workbook is opened or recalculated. This is what makes our report dynamic. - The
IF()function: We'll use this to check if an invoice is actually past due. If the due date is in the future, the "Days Past Due" should be 0. Otherwise, we calculate the difference between today's date and the due date.
The formula looks like this: IF([@DueDate]>=TODAY(), 0, TODAY()-[@DueDate])
Note: The [@DueDate] is an example of a structured reference from our Excel Table.
Let's see this in action.
Create an Accounts Receivable Aging Report in Excel
The same video continues by demonstrating how to create the 'Days Past Due' column.
Watch the section from this point to see how the presenter uses an IF and TODAY function to calculate the days outstanding for each invoice.
Step 3: Categorize Invoices into Aging Buckets
This is the core of the report's logic, where we assign each invoice to a specific aging category (e.g., "Current," "31-60 Days," "61-90 Days," etc.). There are several ways to do this, but the most robust and scalable method is to use a lookup table with VLOOKUP.
This approach separates your aging logic from your formulas. If you ever need to change your aging buckets (e.g., add a "120+ Days" category), you only have to update the small lookup table, not every formula in your main data table.
Here's how it works:
- Create a small, two-column table elsewhere in your workbook to define the aging buckets. The first column must be the minimum number of days for that bucket, sorted in ascending order.
- Use a
VLOOKUPformula with therange_lookupargument set toTRUE(for an approximate match). Excel will find the largest value in the first column of the lookup table that is less than or equal to your 'Days Past Due' value, and return the corresponding category.
This is a powerful technique. The following video clip explains it perfectly.
Create an Accounts Receivable Aging Report in Excel
This is the most efficient way to handle categorization logic in Excel.
Watch from this segment to learn how to create a lookup table and use an approximate match VLOOKUP to assign an aging category to each invoice.
Alternative Method: The IFS function
Another modern approach is to use the IFS function (or nested IF functions in older Excel versions). This embeds the logic directly into the formula. For example:=IFS([@DaysPastDue] > 90, "Over 90 Days", [@DaysPastDue] > 60, "61-90 Days", [@DaysPastDue] > 30, "31-60 Days", TRUE, "0-30 Days")
This works well but is less maintainable than the VLOOKUP method. The image below shows a similar logic using IF and AND to place the value directly into the correct aging column, which is yet another way to structure the report.
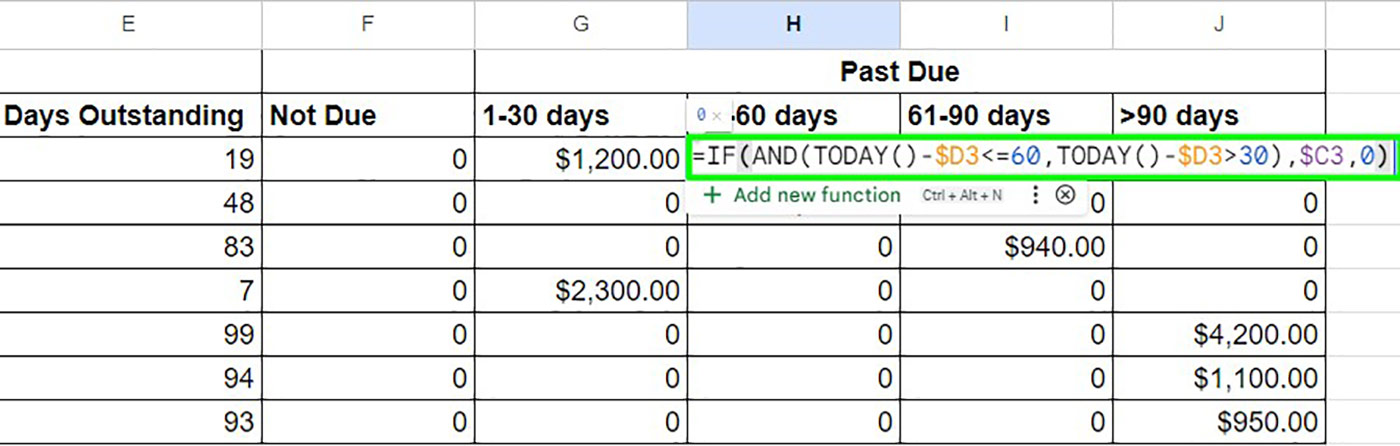
For our purposes, we will proceed with the more flexible VLOOKUP and PivotTable method.
Step 4: Summarize and Visualize the Report
With our data prepared and categorized, the final step is to create a summary report and visualize it. A PivotTable is the ideal tool for this.
Create an Accounts Receivable Aging Report in Excel
This part of the video brings it all together, creating the final summary and chart.
First, watch how to create a PivotTable summary that groups the total amounts by aging category and by customer. Then, continue watching from this point to see how a stacked column chart is created from the PivotTable to provide a powerful visual representation of the outstanding receivables.
The result of these steps is a professional and dynamic dashboard. By adding a PivotTable, charts, and perhaps key metrics like "Total Overdue AR", you can create a comprehensive analysis tool like the one shown here.

Finally, remember the main reason we used an Excel Table at the start? If you add new invoice data to the bottom of your data table and refresh the PivotTable, the entire report updates automatically.
Create an Accounts Receivable Aging Report in Excel
This final clip demonstrates the power of building your report on an Excel Table.
Watch the short segment from here to see how adding new data and refreshing the report works seamlessly.
Conclusion
In this lesson, you have successfully constructed a complete, dynamic accounts receivable aging report. You have leveraged a combination of date functions (TODAY), logical lookups (VLOOKUP), and summarization tools (PivotTables) to turn raw data into actionable financial insight. This report is indispensable for managing cash flow, and the techniques you used—especially combining Tables with PivotTables—are central to creating automated reports in Excel.
Key Takeaways:
- Always start by converting raw data into an Excel Table for dynamic, automated reporting.
- The
TODAY()function is the engine that keeps date-based reports current. - Using
VLOOKUPwith a separate lookup table is the most scalable and maintainable way to handle categorization logic like aging buckets. - A PivotTable is the fastest way to summarize categorized data into a meaningful report.
- Visualizations like stacked column charts make it easy to see the composition of your receivables at a glance.
This lesson marks the end of our module on financial analysis with formulas. We are now ready to take a major step toward your goal of automation. In our next module, we will be introduced to automation with macros, where you will learn to record, run, and edit simple VBA code to automate repetitive tasks with the click of a button.