Welcome to the next stage of building our financial model. In the last lesson, we established the critical principles of separating your data, calculations, and presentation layers, and we learned how to use named ranges to make your model's inputs clear and robust. Today, we put that structure to work by building the engine of our model: the calculation layer.
Our focus will be on constructing a dynamic Income Statement, which directly addresses the learning outcome for this lesson. We will take raw accounting data—a trial balance—and use one of Excel's most powerful functions for accountants, SUMIFS, to automatically aggregate that data into a professional P&L report. This is a fundamental skill that transforms Excel from a simple calculator into a powerful tool for automated financial reporting.
The Foundation: Understanding the Trial Balance
As you know from your accounting studies, a financial statement starts with the trial balance (TB). The TB is an export from the general ledger that lists every account with its closing balance for a given period. For our purposes, we are interested in the income and expense accounts, which form the basis of the Income Statement.
A typical data export might look something like this:
| Account No. | Account Name | Period | Amount |
|---|---|---|---|
| 4000 | Product Sales - Online | 12/31/2024 | 88,200 |
| 5010 | Manufacturing Labor | 12/31/2024 | -27,000 |
| 6000 | Salaries - Admin | 12/31/2024 | -11,250 |
An essential best practice is to ensure that revenues are positive numbers and expenses are negative. This allows you to use the SUM function for all aggregations, which simplifies formulas and reduces the risk of errors.
The following resource provides a clear overview of the trial balance data we will use as our starting point.
Build a Profit & Loss Statement in Excel: Practical Guide
This article from Accelerate Excel begins by explaining the role of trial-balance data.
Please read the introductory section and the part titled "Starting Point: Trial-Balance Data". Pay close attention to the sample data table and the note on keeping opposite signs for income and expenses.
The Bridge: Mapping Accounts to Report Lines
The raw trial balance contains a high level of detail (e.g., 'Salaries - Admin', 'Salaries - Sales'). A summary P&L, however, needs to group these into a single line item, like 'Personnel'. The process of creating this connection is called mapping.
A mapping table is a simple but powerful tool—it's a list that acts as a "Rosetta Stone," translating each granular general ledger account number to the specific line item where it belongs on your financial statements.
Creating this map is arguably the most crucial step in automating financial reports. It centralizes your reporting logic, making your model:
- Consistent: The same mapping can be used month after month.
- Flexible: If you need to reclassify an account (e.g., move a specific expense from 'Admin' to 'COGS'), you only change it in one place—the mapping table—and your entire P&L updates automatically.
- Scalable: When new accounts are added to the general ledger, you simply add them to your mapping table. You don't need to rewrite any of your P&L formulas.
This process transforms a static report into a dynamic model.
Build a Profit & Loss Statement in Excel: Practical Guide
The same article provides an excellent, in-depth explanation of creating and using a mapping table.
Read the section titled "Side Note on Mapping Tables" to understand the "Why". Then, review the "Step-by-Step Guide to Prepare Data" to see the "How". Don't worry about following every single keyboard shortcut; focus on understanding the three main stages described: Convert Raw Data to a Table Prepare the Account Mapping (by creating a unique list of accounts and adding category columns) Merge Account Mapping with Raw Data (using a lookup formula to add the categories to your main data table)
This data preparation phase, where you merge the mapping information with the raw TB data, creates an enriched data source. This is the "Inputs" layer of our model, now ready for the "Calculation" layer.
The Engine: Aggregating Data with SUMIFS
With our enriched trial balance table, we are now ready to build the P&L itself. We will use the SUMIFS function to pull the numbers from our data table into our P&L structure.
The syntax for SUMIFS is:SUMIFS(sum_range, criteria_range1, criteria1, criteria_range2, criteria2, ...)
In our case, to calculate the value for each line on our P&L (e.g., Revenue for FY24), we will tell Excel to:
"Sum the [Amount] column...
- ...where the [AccountLevel3] column matches our P&L line item (e.g., "Revenue").
- ...and where the [Period] column matches our desired year (e.g., "12/31/2024")."
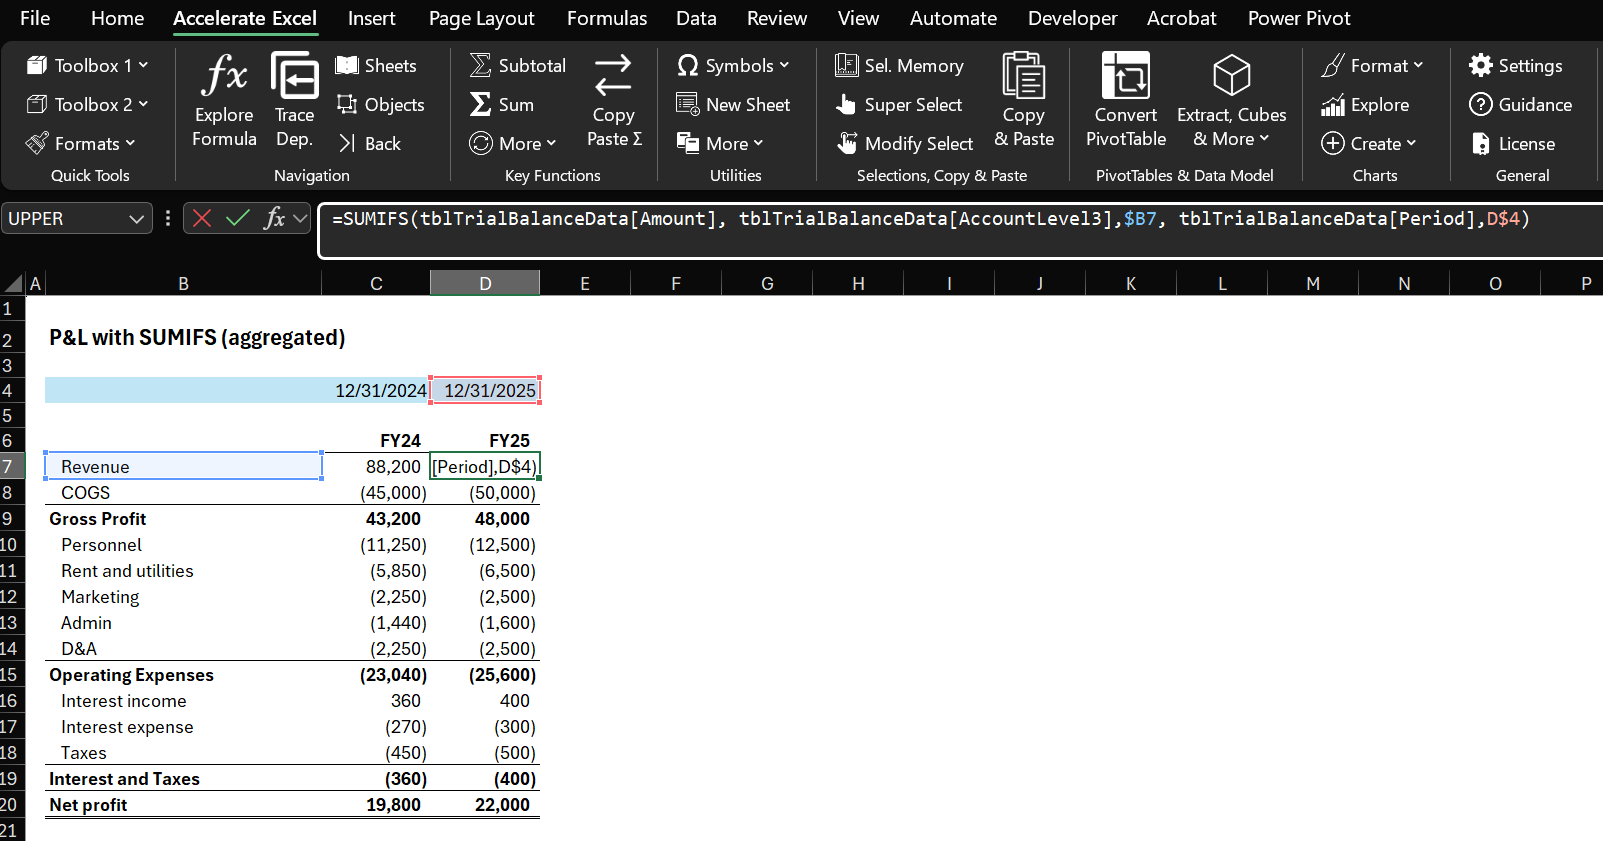
This is where the power of dynamic reporting comes to life. By using mixed cell references (like $B7 and D$4), we can write one formula and copy it across our entire report to populate every line item for every period.
The image below shows the final result. Notice the SUMIFS formula in the formula bar, which references the data table (tblTrialBalanceData) and uses mixed references for the criteria ($B7 and D$4).
The following video provides a concise demonstration of this process. The presenter uses SUMIF, but the logic is identical for SUMIFS when you have multiple criteria like we do (account category and time period).
Turn a Trial Balance into an Income Statement in 4 steps
This video from The Financial Controller walks through the process of labeling accounts and using a SUMIF formula.
Watch the section on labeling the accounts, which is the mapping concept we just discussed. Then, watch how the SUMIF formula is used to aggregate the data based on those labels.
Step-by-Step Construction Guide
You now understand the components: the data, the map, and the formula. The following guide provides the detailed steps to put it all together.
Build a Profit & Loss Statement in Excel: Practical Guide
This final section of the article is a practical guide to building the P&L report using the data we just prepared.
First, read the section Create P&L Using SUMIFS Formulas for a clear explanation of the formula and its components. Then, work through the detailed instructions in How to Create P&L with SUMIFS (Step-by-Step). This covers preparing the report structure, writing the SUMIFS formula with correct cell references, and adding subtotals and formatting.
After populating the main values with SUMIFS, the final step is to add the subtotals (like Gross Profit and Net Income) using simple SUM formulas, completing your dynamic Income Statement.
Conclusion
In this lesson, you have built the computational core of a professional financial report. You have moved beyond manual data entry and created a dynamic system where the presentation is driven by formulas linked to a well-structured data source.
Key Takeaways:
- A mapping table is the essential bridge between granular trial balance data and summary financial statements.
- Enriching your raw data by adding mapping categories via lookup functions creates a powerful and flexible source for reporting.
- The
SUMIFSfunction is the engine that aggregates your data, using multiple criteria (like account category and period) to populate your report. - Using Excel Tables for your source data and mixed cell references in your
SUMIFSformula allows you to build a robust report that is easy to update and maintain.
You've now applied the principles from our previous lessons to build a dynamic P&L. The beauty of this approach is its reusability. In our next lesson, we will leverage the very same enriched trial balance data to build a dynamic Balance Sheet, reinforcing these skills and demonstrating the efficiency of this modeling technique. We will also add a crucial validation: a check formula to ensure our Balance Sheet always balances.