Welcome to our fourth lesson. In the previous session, we built a foundational understanding of decision trees, exploring their structure and the high-level process by which they learn from data. We noted that the learning algorithm has several "stopping criteria," such as a maximum tree depth, which prevent it from growing indefinitely.
Today, we'll explore the critical reason for these stopping rules by examining two of the most fundamental challenges in machine learning: Overfitting and Underfitting. Your learning outcome is to define Overfitting and Underfitting using a decision tree as an example, and explain how to recognize them in exam scenarios. Understanding this trade-off is not just theoretical; it's a practical skill essential for interpreting model performance, a common task in exams.
1. The Core Problem: Learning vs. Memorizing
The goal of any supervised learning model is to learn general patterns from the training data that can be used to make accurate predictions on new, unseen data. However, a model can fail in two opposite ways. It can either fail to learn the patterns altogether, or it can learn them too well.
Let's start with a clear definition of these two failure modes.
Tuning Tree Depth to Prevent Overfitting in Decision Trees
This article from CodeSignal Learn uses a simple fruit analogy to explain the concepts of overfitting and underfitting in the context of decision trees.
Please read the section How Tree Depth Affects Overfitting. Focus on how the analogy of simple vs. overly specific rules for identifying fruit maps to the concepts of underfitting and overfitting.
As the reading explains:
- Underfitting: The model is too simple. It overlooks important patterns in the data and fails to achieve good performance, even on the data it was trained on. This is like using only one rule ("if it's red, it's an apple") to identify all fruits.
- Overfitting: The model is too complex. Instead of learning the general pattern (the "signal"), it also learns the random noise and specific quirks of the training data. It performs perfectly on the training data but fails to generalize to new data. This is like memorizing every single detail of the apples you've seen, including their exact weight and stem length.
These concepts are formally linked to what are known as bias and variance.
- Underfitting is a problem of high bias. The model's assumptions are too simplistic and biased, leading to systematic errors.
- Overfitting is a problem of high variance. The model is highly sensitive to the specific training data it saw; train it on a slightly different dataset, and you'll get a very different model.
2. Overfitting and Underfitting in Decision Trees
In our last lesson, we saw that a decision tree is built by recursively splitting the data. The depth of the tree—the longest path from the root to a leaf—is a direct measure of its complexity. This makes the decision tree a perfect model for visualizing the effects of complexity.
- A shallow tree (with a small maximum depth) is a simple model. It can only ask a few questions, so it can only learn very general patterns. If it's too shallow, it will underfit.
- A deep tree (with a large or unlimited depth) is a complex model. It can ask many questions, allowing it to create highly specific rules that carve out tiny, pure nodes for the training data. If it's too deep, it will overfit.
This short video clip provides a memorable analogy for this exact scenario.
Intro to Machine Learning Lesson 5 Underfitting and Overfitting Kaggle
This video from Kaggle uses a pancake recipe to illustrate how too few or too many splits in a decision tree lead to underfitting and overfitting.
Watch the section from the sugar example. Notice how a split based on "less than one cup of sugar" is too general (underfitting), while splits based on individual "grains of sugar" are too specific (overfitting).
When a decision tree is allowed to grow to its full depth without any constraints, it tries to create perfectly pure leaf nodes for the training data. This process is the classic cause of overfitting.
Machine Learning-Bias And Variance In Depth Intuition| Overfitting Underfitting
Krish Naik explains why a default decision tree is prone to overfitting.
Watch this segment from the overfitting condition. The key insight is that a tree grown to its complete depth will have low bias (it fits the training data well) but high variance (it won't generalize to test data).
3. The Bias-Variance Trade-off
This brings us to a central concept in machine learning: the bias-variance trade-off. You cannot simply minimize both bias and variance independently. As you make a model more complex to reduce its bias (to better fit the data), you inevitably increase its variance (making it more likely to overfit). The goal is to find a "sweet spot" of complexity that minimizes the model's total error on unseen data.
This relationship is often visualized with a U-shaped curve.
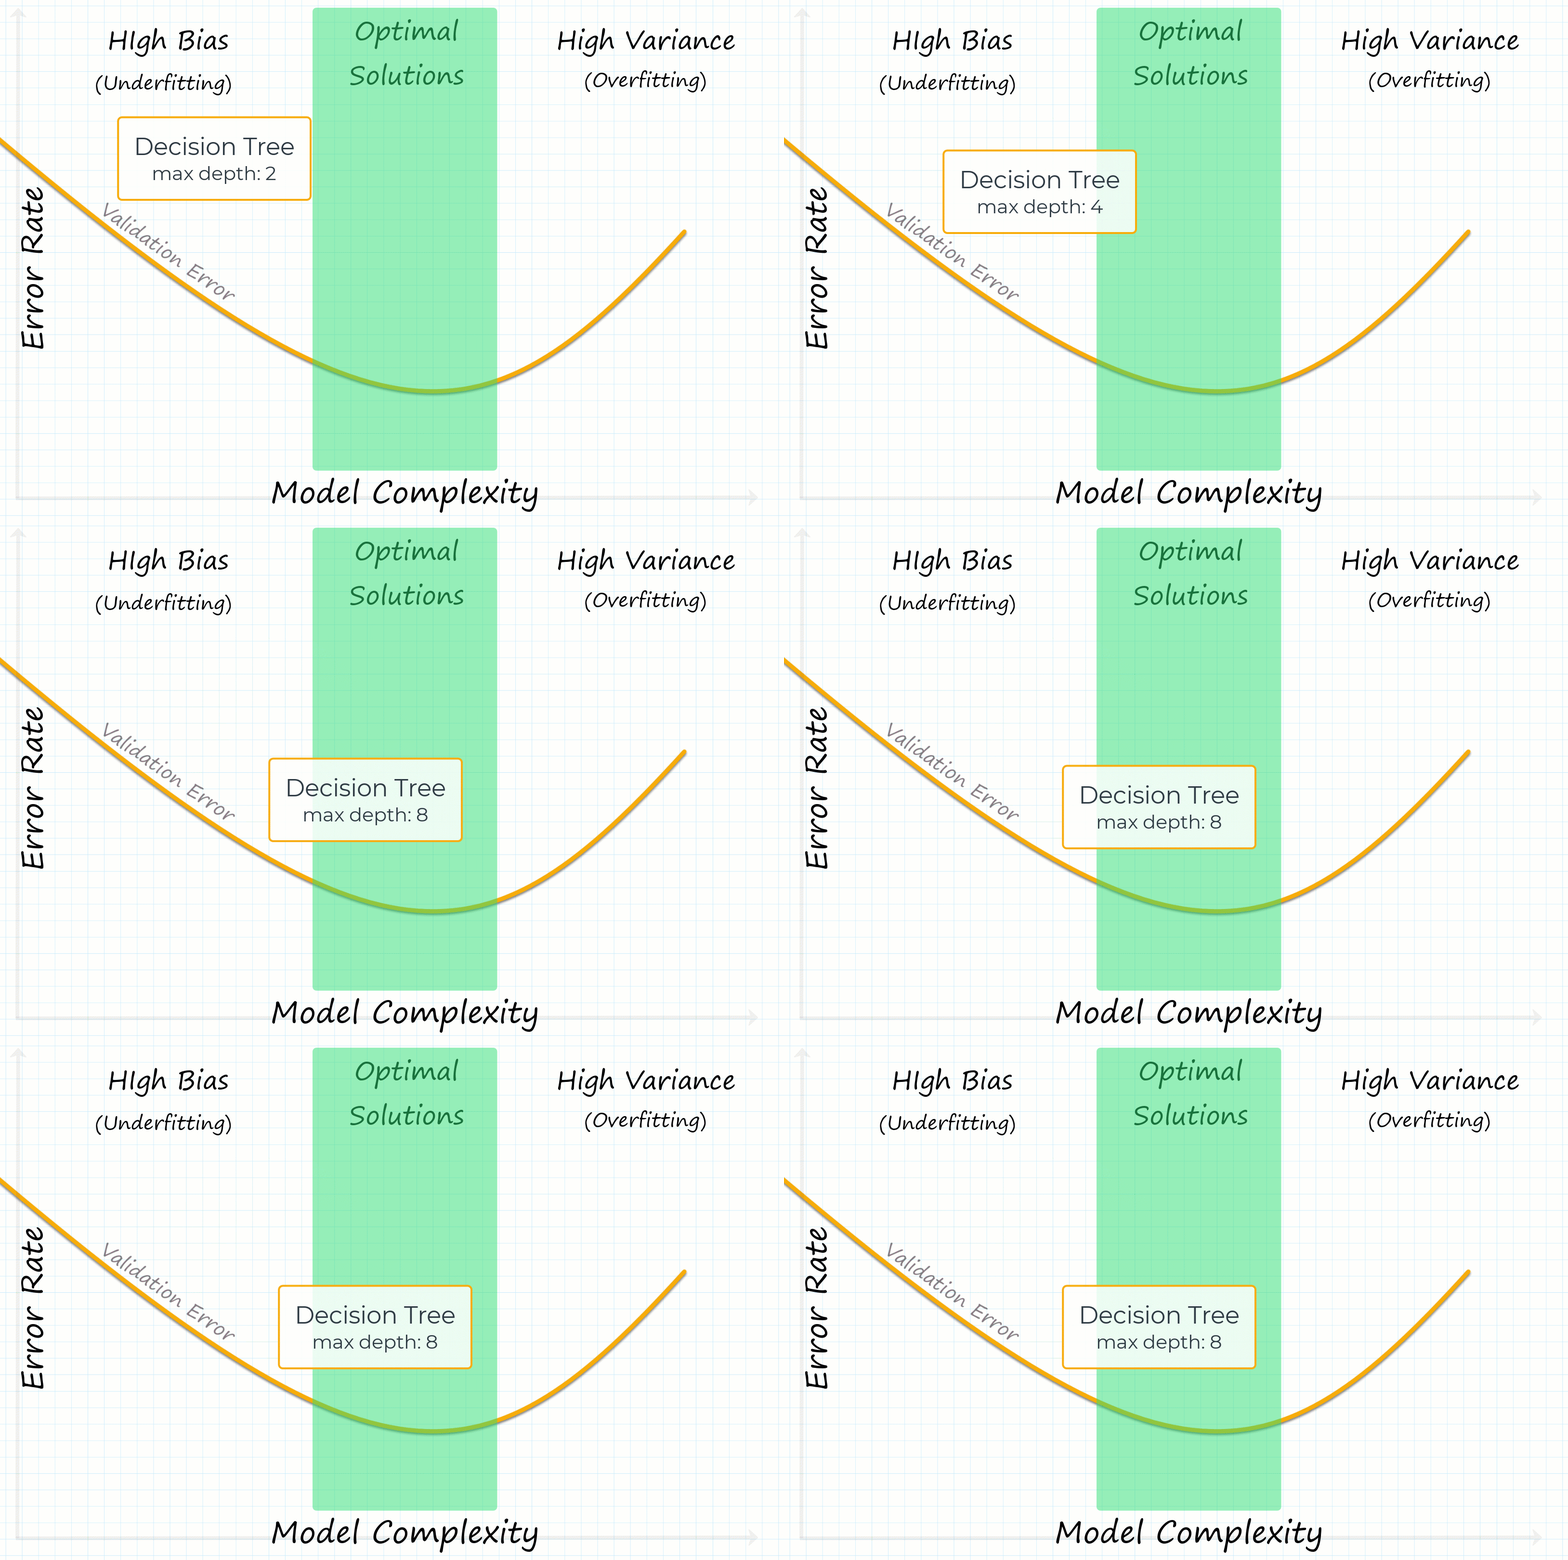
As you increase a decision tree's max_depth, you are moving from left to right along the "Model Complexity" axis of this graph. Initially, as the tree gets deeper, the error on new data (validation error) decreases. But after a certain point, the model starts to overfit, and the validation error begins to climb again.
4. How to Recognize Underfitting and Overfitting for an Exam
For your exam, you will likely be given a model's performance metrics and asked to diagnose the problem. The key is to compare the error (or accuracy) on the training set versus the validation set (unseen data).
- Training Error: How well the model performs on the data it was trained on.
- Validation Error: How well the model performs on new data it has never seen before.
Here is a guide to interpreting the numbers, which is a very common exam question format.
Bias-Variance Tradeoff: Underfitting, Overfitting, and How to Fix Both – Tech Interview Dot Org
This article from Tech Interview Dot Org provides a concise, practical guide to diagnosing bias and variance from error metrics.
Please read the section titled Diagnosing the Problem. Pay close attention to the four cases presented; they are the classic scenarios you need to recognize.
Let's summarize those crucial rules of thumb:
- High Bias (Underfitting): Training error is high, and validation error is also high (and close to the training error).
- Example: Training Error: 15%, Validation Error: 16%.
- Symptom: The model is just not good. It can't even learn the training data.
- High Variance (Overfitting): Training error is very low, but validation error is high.
- Example: Training Error: 1%, Validation Error: 18%.
- Symptom: There is a large gap between training and validation performance. The model has memorized the training data but cannot generalize.
- Good Fit: Training error is low, and validation error is also low (and close to the training error).
- Example: Training Error: 3%, Validation Error: 5%.
- Symptom: The model is performing well on both seen and unseen data. It has generalized successfully.
The following image provides a fantastic summary, showing what underfitting, a good fit, and overfitting look like for different types of problems.

Take a moment to study this image. Note the "Symptoms" row, which reiterates the error patterns we just discussed. The "Possible remedies" row is also valuable:
- To fix underfitting, you need to increase model complexity (e.g., make the decision tree deeper, add more features).
- To fix overfitting, you need to decrease model complexity (e.g., make the tree shallower, use pruning) or get more data.
Conclusion
In this lesson, we've tackled the essential concepts of overfitting and underfitting. You now have a framework for understanding one of the most important trade-offs in machine learning.
Here are the key takeaways for your exam:
- Underfitting (High Bias): The model is too simple and fails to capture the underlying patterns. It performs poorly on both training and test data.
- Overfitting (High Variance): The model is too complex and memorizes the noise in the training data. It performs extremely well on training data but poorly on test data.
- The Diagnostic Tool: The key to identifying these issues is to compare training error and validation error. A large gap between them is the classic sign of overfitting. High error on both is a sign of underfitting.
- Decision Tree Complexity: For a decision tree, model complexity is directly controlled by its depth. A very shallow tree underfits, while a very deep tree overfits.
In our previous lesson, we asked how a decision tree decides which feature to split on at each node. In our next lesson, we will answer that question precisely by exploring the mathematical formulas for Entropy and Gini Impurity. These metrics are what the algorithm uses to find the "best" split, and understanding them provides a deeper insight into the greedy learning process we've discussed.