Introduction
In our last lesson, we established that interest rates act like gravity on asset prices. A single number—the risk-free rate, derived from government bonds—can reprice the entire stock market by changing the math in every valuation model. But the bond market is far more than a source for a single discount rate. It is a vast, collective intelligence, constantly pricing the future. Its signals often precede moves in the stock market by months.
Today, we learn to read its most important signal: the yield curve. You will learn to interpret the shape of the yield curve—normal, flat, and inverted—to understand what the world's biggest and arguably smartest market is forecasting about future economic growth, inflation, and recessions. This isn't academic theory; it's a core tool used by professional macro traders and investors to anticipate major shifts in market regimes and position themselves accordingly.
What is the Yield Curve?
A yield curve is a line that plots the interest rates (or yields) of bonds having equal credit quality but different maturity dates. For our purposes, we'll focus on the most-watched yield curve in the world: the one for U.S. Treasury securities. It shows the yield you'd get for lending money to the U.S. government for periods ranging from one month to 30 years.
Take a look at the different shapes a yield curve can take.
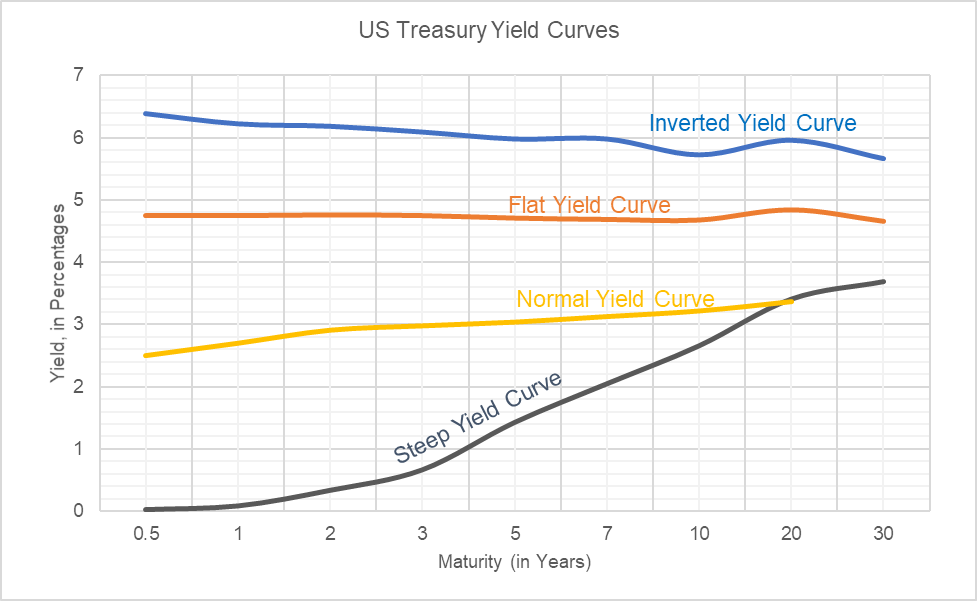
In a "normal" environment, the curve slopes upward. This makes intuitive sense. Lending your money for 10 years involves more risk and uncertainty (e.g., future inflation) than lending it for three months. Therefore, you demand a higher yield for the longer commitment. This additional compensation for lending long-term is called the term premium.
What the Shape-Shifting Yield Curve Is Telling Us About Markets
This article from Hartford Funds clearly explains the logic behind the normal, upward-sloping yield curve.
Read the section titled "Why Is an Upward Sloping Curve Considered ‘Normal?’". Focus on understanding the concept of the "term premium" as compensation for risks like inflation and opportunity cost over longer time horizons.
The shape of this curve, however, is not static. It changes constantly, reflecting the bond market's shifting views on economic growth, inflation, and central bank policy. Decoding these shapes is the key to using the yield curve as a forecasting tool.
The Three Key Shapes and Their Signals
The yield curve's shape is a powerful summary of market sentiment. Let's break down the three primary shapes and what they signal.
Yield Curve Dynamics: Impact on Markets and Trading Strategies
This resource from Bookmap provides a concise table that defines each curve shape and its economic meaning.
Focus only on the table under the heading "Different Shapes of Yield Curves". This will give you a clear, structured overview of the Normal, Inverted, and Flat curves.
Let's synthesize this information:
-
Normal (or Steep) Yield Curve:
- Shape: Slopes upward, with long-term yields significantly higher than short-term yields. A "steep" curve is simply a more pronounced version of a normal curve.
- Signal: A healthy, expanding economy. The market expects strong growth and potentially rising inflation in the future, demanding a higher term premium. This environment is also highly profitable for banks, which borrow at low short-term rates and lend at high long-term rates (this is their Net Interest Margin or NIM).
- Equity Market Impact: Generally bullish. Cyclical sectors that benefit from economic growth (industrials, materials) and financials tend to perform well.
-
Flat Yield Curve:
- Shape: Very little difference between short-term and long-term yields.
- Signal: Uncertainty and transition. This often occurs late in an economic cycle when the central bank has been hiking short-term rates to slow the economy. The market is weighing whether growth will continue or a slowdown is imminent.
- Equity Market Impact: A period of caution and rotation. The easy money has likely been made, and leadership may shift towards more defensive sectors.
-
Inverted Yield Curve:
- Shape: Slopes downward. Short-term yields are higher than long-term yields. This is the anomaly, the signal that something is wrong.
- Signal: The bond market is screaming "recession ahead." Why would investors accept a lower yield for a 10-year bond than a 2-year bond? Because they expect a significant economic downturn that will force the central bank to slash short-term interest rates in the future. They are so eager to lock in today's long-term rates before they fall that they bid up the price of long-term bonds, pushing their yields down below short-term rates.
- Equity Market Impact: A major red flag for the stock market. An inverted curve cripples bank profitability and signals a future drop in corporate earnings across the board.
The Inverted Curve: The Market's Most Feared Signal
An inverted yield curve is one of the most reliable recession predictors ever discovered. An inversion of the 10-year and 2-year Treasury yields, for example, has preceded every U.S. recession for the past 50 years.
However, the "operator" insight is in the timing. A recession doesn't start the moment the curve inverts. The lag can be long, often 6 to 24 months. Crucially, the real danger for the stock market often appears when the curve begins to un-invert and steepen again. This happens because the market starts to aggressively price in the imminent central bank rate cuts that are a response to the unfolding crisis.
This video demonstrates this powerful historical pattern.
Unlocking the Secrets: Yield Curve Inversion and Its Impact on Stock Market Performance
The presenter from ASX Trader does a fantastic job of showing, not just telling, how the yield curve has predicted past market turmoil.
First, get the context of the inversion signal by watching from this segment. It shows the strong correlation between the yield curve going below zero (inverting) and a subsequent recession. Now, watch the critical part from this section. The presenter walks through four major historical crashes (COVID, GFC, Tech Bubble, 1989) and shows how the stock market crash coincided not with the inversion itself, but with the un-inversion. This is a non-obvious and vital pattern. Finally, understand the time lag by watching from this discussion. It highlights that, on average, a recession follows an inversion by about 20 months.
This gives us an actionable mental model:
Inversion → Wait (The lag period) → Un-inversion → Maximum Danger for Equities
The chart below shows this relationship over 50 years. The red periods mark an inverted yield curve. Notice how recessions (the gray bars, not explicitly shown but implied by the negative market performance) and market downturns often follow these inversions.

How the Yield Curve's Shape Drives Sector Performance
The shape of the yield curve doesn't just predict the overall economy; it creates direct headwinds and tailwinds for different stock market sectors. The most direct relationship is between Financials and Growth/Tech stocks.
How Does the Yield Curve Impact Stocks?
In this video, market technician Dave Keller explains the practical impact of the yield curve on stock sectors. He provides a clear framework for thinking about these relationships.
First, watch the primer on the yield curve from this section. Pay close attention to the explanation of how a steep curve benefits banks' business models, while an inverted curve hurts them. Next, watch the segment from here. The presenter overlays a chart of the yield spread (10yr - 2yr) with the relative performance of the Financials sector (XLF) and the Growth-heavy Nasdaq (QQQ). The visual correlation is undeniable: as the curve steepens (line goes up), financials outperform. As it flattens, financials underperform and growth often takes the lead.
Let's summarize the dynamic:
-
When the curve is STEEPENING (usually indicating economic strength):
- Financials (Banks): Strong tailwind. Their lending margins expand, driving higher profits.
- Growth Stocks: Potential headwind. A steepening curve often involves rising long-term yields, which, as we learned in the last lesson, increases the discount rate and compresses the valuation of long-duration growth stocks.
-
When the curve is FLATTENING/INVERTING (usually indicating economic weakness):
- Financials (Banks): Strong headwind. Their lending margins get squeezed, hurting profitability.
- Growth Stocks: Potential tailwind. A flattening curve often precedes central bank rate cuts. The anticipation of lower future discount rates can make growth stocks look more attractive, causing capital to rotate into them.
By watching the 10-year vs. 2-year yield spread, you have a live indicator of the powerful rotation happening under the market's surface between value/cyclicals and growth/tech.
Conclusion
You now have a framework to decode the bond market's most important message. The yield curve is not just a graph; it's a dynamic forecast of the economic future, with direct and tradable consequences for equity markets.
Key Takeaways:
- The yield curve's shape reflects the bond market's collective expectation for growth and inflation. A normal/steep curve signals a healthy economy, a flat curve signals uncertainty, and an inverted curve is a powerful recession warning.
- The inverted yield curve has a formidable track record of predicting recessions, but the timing is key. The stock market often faces maximum danger not during the inversion, but when the curve begins to un-invert and steepen again.
- The shape and movement of the yield curve create direct headwinds and tailwinds for stock market sectors. A steepening curve is generally bullish for financials and bearish for long-duration growth stocks. A flattening curve does the opposite.
In this lesson, we saw how the yield on a country's government bonds is a critical indicator for its domestic stock market. But these yields also have a powerful influence beyond national borders. In our next lesson, we will explore Currency Markets and FX Basics, and you'll see how differences in yield curves between countries drive massive capital flows that determine the strength or weakness of their currencies.