Introduction
In our last lesson, you learned that markets are forward-looking machines that trade on surprises in economic data. The key question was always, "How will this data influence the central bank?" Now, we move to the next logical step. What happens when the central bank actually acts?
Today's lesson is about the transmission mechanism. We will trace exactly how a central bank's decision to raise or lower its key interest rate ripples through the entire financial system to reprice every single asset, from stocks to bonds to real estate. Your goal is to understand the direct, mechanical links between a rate decision and an asset's price, altering both its valuation math and the real-world conditions in which it operates. As Warren Buffett famously said, "Interest rates are to asset prices what gravity is to the apple." Today, you learn the physics of that gravity.
The Central Bank's Control Panel and the Transmission Map
Every major economy has a central bank (like the US Federal Reserve or the Reserve Bank of India) whose primary mandate is to maintain price stability (control inflation) and support maximum employment. Their most powerful tool is the policy interest rate—the rate at which commercial banks can borrow money. By setting this foundational rate, they influence the cost of money for the entire economy.
Before we dive into the mechanics, let's look at a high-level map of this process.
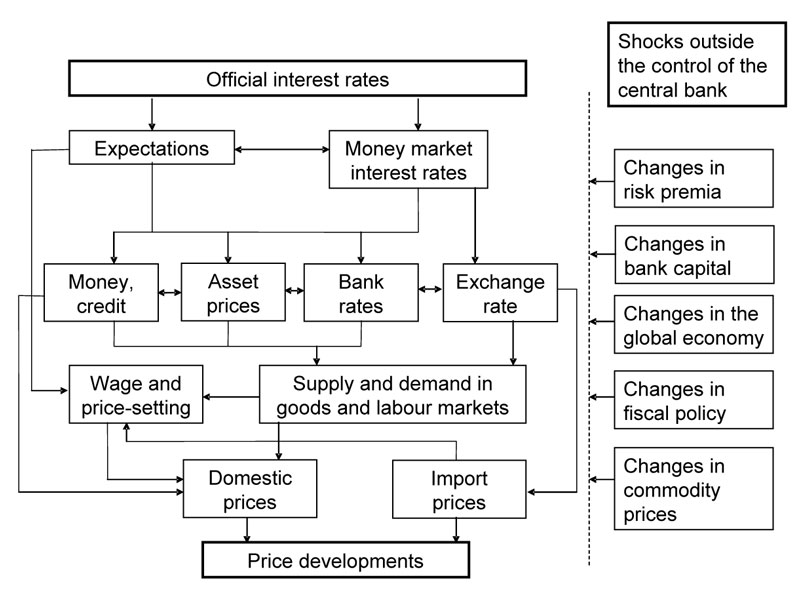
This chart shows two primary paths through which a rate decision travels:
- The Credit Channel: Affecting the "real economy" of borrowing, spending, and investment.
- The Valuation Channel: Directly repricing financial assets in the market.
We will dissect both, starting with the one that affects Main Street before hitting Wall Street.
Channel 1: The Credit Channel – Tightening the Screws on the Real Economy
The most intuitive effect of a rate hike is that it makes borrowing more expensive. The central bank's policy rate acts as a floor for all other rates. When it goes up, so do mortgage rates, car loans, credit card APRs, and, crucially, the loans that businesses use to fund operations and expansion.
This is the credit conditions channel.
How Interest Rates Affect the Market | StableBread
This article from StableBread provides a clear, foundational overview of the key rates and their impact on the economy.
First, read the section on the key rates to understand the relationship between the central bank's policy rate (the federal funds rate in the US) and the rates faced by consumers and businesses. Next, focus on the section "Interest Rates and Economic Growth". Pay close attention to the separate impacts on businesses and consumers. This explains the real-world consequences of changing credit conditions.
When the central bank raises rates:
- For Businesses: The cost of capital increases. A new factory, a software upgrade, or hiring a new team—all funded by debt—become more expensive. Projects that were profitable at a 3% interest rate might be unprofitable at 6%. The logical response is to delay investment, cut costs, and freeze hiring.
- For Consumers: Monthly payments on variable-rate mortgages and credit card debt rise, squeezing disposable income. New loans for houses and cars become less affordable. Consumer spending, the engine of the economy, slows down.
This process is deliberate. To fight inflation, a central bank wants to "destroy demand," as you'll hear analysts say. It's a blunt instrument, and as the article notes, there's a time lag of about 12 months for the full effect to filter through the economy. However, the market doesn't wait. It reacts instantly through the second, more powerful channel.
Channel 2: The Valuation Channel – The Gravity of Discount Rates
While the credit channel works slowly, the valuation channel is immediate. It doesn't rely on consumers changing their spending habits; it relies on investors and algorithms changing the numbers in their valuation models.
This brings us back to the core of valuation you learned in Module 3: a company's worth is the present value of its future cash flows, discounted back to today.
The key variable here is , the discount rate. This rate represents the return an investor could get on a risk-free investment, plus a premium for the risk of investing in that specific company. The most common "risk-free" asset is a government bond, and its yield is directly influenced by the central bank's policy rate.
When the central bank raises interest rates, government bond yields rise. This increases the risk-free rate () component in every valuation model on the planet.
Let's see this in action. The Weighted Average Cost of Capital (WACC) is often used as the discount rate. It's a blend of a company's cost of debt and cost of equity. Both are directly impacted by rate hikes.
Explaining Why Interest Rates and Inflation Affect the Stock Market
This video from the channel rareliquid provides an excellent, quantitative walkthrough of how a rate hike flows directly into a company's valuation via the WACC. It's perfect for connecting the macro decision to a specific stock price.
First, watch the conceptual setup explaining the WACC and DCF. This will refresh your memory from Module 3. Next, watch the breakdown of the WACC formula. Pay close attention to how both the cost of debt and the cost of equity (via the risk-free rate) are tied to the federal funds rate. Finally, watch the critical demonstration from the Google DCF example. The presenter shows how a 2% increase in the expected interest rate raises the WACC from 8.2% to 10.1%, causing the calculated share price to drop by nearly 25%—from $3050 to $2217.
This is the mechanism. It's pure math. The company's future cash flows haven't changed. The business is the same. But because the "gravity" of the risk-free rate has increased, the present value of those future cash flows is lower. The asset has been repriced.
The Duration Effect: Why Growth Stocks Get Crushed
This valuation effect is not uniform. Some stocks are far more sensitive to changes in the discount rate than others. This is where the operator's mindset comes in—knowing which parts of the market will be hit hardest.
The key concept is analogous to duration in bonds. An asset's value is more sensitive to discount rate changes if its cash flows are expected to arrive far in the future.
- Value Stocks: Mature, stable companies (e.g., a large bank or consumer goods company) that generate predictable cash flows today. A large portion of their value comes from earnings in the next few years.
- Growth Stocks: Companies (e.g., a young software firm) that may be barely profitable today but are expected to generate massive cash flows 10 or 15 years from now. Almost all of their value is tied up in those distant-future earnings.
When you increase the discount rate, that (1 + r)^t denominator in the DCF formula has a much larger effect when t (time) is large. A 2% rate hike has a punishing, compounding effect on cash flows expected in year 10, but a much smaller effect on cash flows expected next year.
This is why rising interest rates are poison for speculative, high-growth technology stocks.
Interest Rate Effects on Equities: Valuation Impacts - Lyn Alden
Analyst Lyn Alden provides a masterful quantitative illustration of this concept. You will see three distinct DCF models that show precisely how rate-sensitive different types of stocks are.
Read the section starting here. Follow the three examples for a Value Stock, Growth Stock, and Hypergrowth Stock. In each case, the discount rate is lowered from 12% to 8% (the equivalent of a rate cut). Focus on the final result: Value stock's valuation increases by 44.7%. Growth stock's valuation increases by 61.8%. Hypergrowth stock's valuation increases by 89.9%. Now, simply invert the logic for a rate hike. A move from 8% to 12% would crush the hypergrowth stock far more than the stable value stock.
The video below gives a real-world example, comparing the performance of Block (formerly Square), a high-growth company, to Apple, a more mature cash-flow generator, during a period of rising rate expectations.
Growth Stocks, Interest Rates and Tapering - Explained
This short clip from Simply Wall St visualizes the concept you just read about.
Watch the segment from this timestamp. The charts clearly show how a high-growth stock with distant cash flows (Block) sold off sharply on rate hike fears, while a company generating massive cash flow today (Apple) was much more resilient.
The Operator's Synthesis
You now have the full picture of how a central bank's decision transmits to asset prices. Let's put it all together into a working mental model.
The central bank announces a series of rate hikes. What happens?
- Instantly: Bond traders sell bonds, causing yields to rise. The "risk-free rate" has been repriced.
- Instantly: Algorithmic and quantitative trading systems update their DCF models with this new, higher risk-free rate. The
rin their valuation formulas increases. - Seconds to Minutes: Sell orders flood the market for the most rate-sensitive assets: long-duration growth stocks, unprofitable tech, and speculative assets. Their present values have been mathematically reduced, and the market adjusts violently.
- Weeks to Months: The credit channel begins to work. News headlines shift from "Fed Hikes Rates" to "Mortgage Rates Hit 10-Year High."
- Months to Quarters: Companies start reporting earnings. They announce reduced capital expenditure plans and lower revenue guidance, citing "macroeconomic headwinds" and "softening consumer demand." This forces analysts to lower their future cash flow estimates, dealing a second blow to valuations.
Take a look at the table below, which shows the policy stance of various central banks.

As an operator, you can now look at this and form immediate, testable hypotheses. Colombia is hiking. What does that imply for the relative performance of growth vs. value stocks in the Colombian market? Brazil is cutting, but its policy is still "Restrictive." This suggests they are still fighting inflation, and the environment may not yet be favorable for the most speculative assets. This is how you connect the macro dots to actionable market insights.
Conclusion
You have now traced the path of a central bank's power from its policy statement all the way to a stock's price. You understand that this is not magic, but a machine with identifiable gears.
Key Takeaways:
- Central bank rate decisions reprice all assets through two main channels: the slow-moving credit channel (affecting real economic activity) and the fast-moving valuation channel (affecting financial models).
- A rate hike increases the risk-free rate, which in turn increases the discount rate (WACC) used in valuation models like the DCF.
- A higher discount rate mathematically reduces the present value of a company's future cash flows, leading to a lower stock price, even if the business itself hasn't changed.
- This effect is most severe for long-duration growth stocks, whose value is heavily dependent on cash flows far in the future. This is why rising rates tend to punish the tech sector most harshly.
In this lesson, you saw how the yields on government bonds are a critical input for valuing stocks. But the bond market is more than just a source for a risk-free rate; it's a giant, collective brain that is constantly signaling its expectations about future growth and inflation. In our next lesson, we will dive deep into Bonds and the Yield Curve to learn how to interpret its signals, which often provide clues about the market's next move long before stock investors react.