Introduction
In our previous lessons, we've systematically dismantled the major macro forces that drive markets: central bank rates, the yield curve, commodity cycles, and fiscal policy. You've seen how each force acts as a powerful current, pushing and pulling on different asset classes. Now, we will synthesize this knowledge. This lesson is about assembling those pieces into a coherent, dynamic model of the market's engine: the business cycle.
Your goal is to learn how the interplay of these forces creates predictable economic phases—recovery, expansion, slowdown, and recession—and, more importantly, how institutional money rotates between market sectors in anticipation of these shifts. This isn't about finding a crystal ball; it's about understanding the high-probability playbook that separates professional operators from retail speculators. By the end, you will be able to identify the stages of the business cycle and explain which sectors are likely to lead or lag in each phase.
The Two Clocks: Market Cycle vs. Economic Cycle
The first and most critical distinction an operator must make is between the economic cycle and the market cycle. The economy is what's happening now; the market is what's expected to happen 6-9 months from now. The stock market is a forward-looking discounting mechanism. It doesn't price in today's news; it prices in the consensus view of the future.
This means the market cycle leads the economic cycle. The market will bottom while the economy is still in a recession, and it will top out while the economy is still expanding. Amateurs get trapped by looking at current rosy economic data, wondering why the market is falling. Professionals are already positioning for the slowdown they see on the horizon.
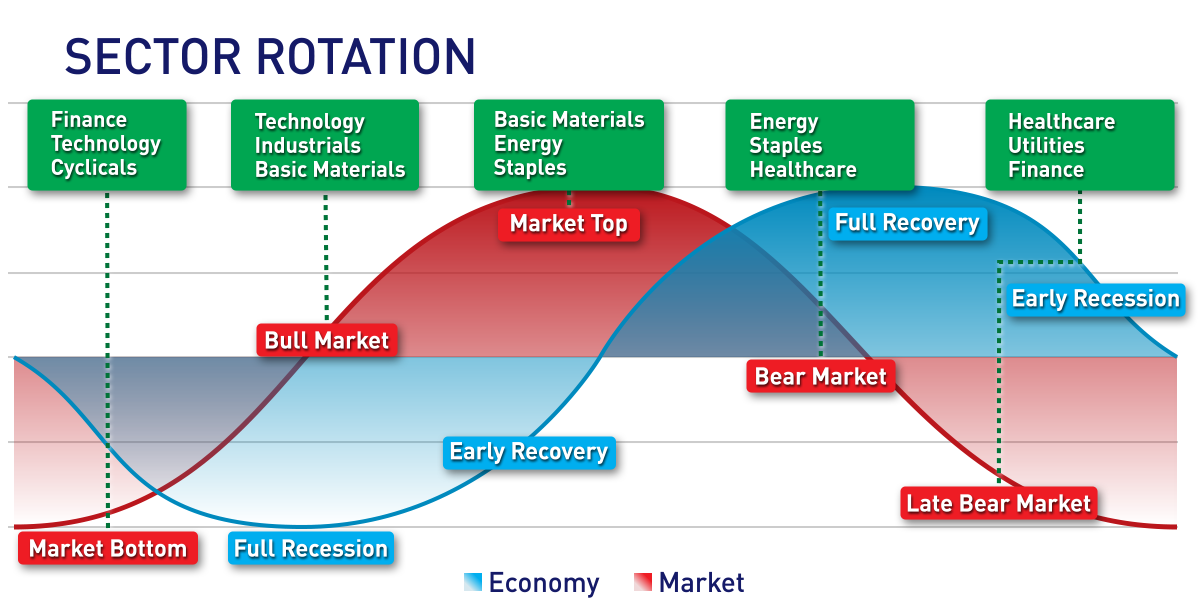
Understanding this lead-lag dynamic is the foundation of a sector rotation strategy.
The Four Phases of the Business Cycle
Economies don't grow in a straight line. They expand and contract in cycles. While every cycle is unique in its details, they typically follow a recognizable four-phase pattern. The following report from Fidelity's Asset Allocation Research Team provides a robust framework for understanding these phases.
[PDF] The Business Cycle Approach to Equity Sector Investing
This report is an excellent, quantitatively-backed guide to the business cycle. We'll use it to define the phases and then to build our sector playbook.
First, read the section describing the four phases to get a clear definition of each stage. Then, jump to the endnotes and read the summary descriptions of the three expansionary phases to reinforce your understanding of their key economic characteristics, especially concerning inflation, monetary policy, and the yield curve.
Let's distill the key features of each phase, connecting them to the concepts we've already covered:
-
Early Cycle (Recovery):
- What it feels like: A sharp rebound from a recession. Economic data starts turning from bad to less bad, then to good.
- Drivers: Central banks have cut interest rates to the bone (accommodative policy), credit becomes easier to access, and government stimulus (expansionary fiscal policy) may be in full swing. Corporate profits explode higher, but from a very low base. Inventories are low, so companies start ramping up production.
-
Mid-Cycle (Expansion):
- What it feels like: The longest and most stable phase of growth. The recovery is now a self-sustaining expansion.
- Drivers: Growth is solid and broad-based. Credit is flowing freely. Corporate profits are healthy. Monetary policy shifts from "easy" to "neutral" as central banks take their foot off the accelerator.
-
Late-Cycle (Slowdown):
- What it feels like: The economy starts "overheating." Growth is still positive but slowing down. Talk of inflation dominates the news.
- Drivers: The economy is running into capacity constraints. The labor market is tight, pushing up wages. Inflationary pressures build (often visible in rising commodity prices). Central banks respond by tightening monetary policy—hiking interest rates to cool things down. The yield curve flattens or even inverts. Profit margins get squeezed.
-
Recession (Contraction):
- What it feels like: A contraction in economic activity. Job losses rise, and business and consumer confidence fall.
- Drivers: The cumulative effect of tight money and credit scarcity chokes off growth. Corporate profits decline. Businesses cut back on investment and lay off workers. In response, central banks begin easing policy, setting the stage for the next recovery.
The Sector Rotation Playbook
If you know which phase of the cycle you are in, you have a probabilistic edge in knowing which sectors will outperform. This is because sectors have different sensitivities to economic growth, inflation, and interest rates.
We can group sectors into three broad categories:
- Cyclical (High Sensitivity): These sectors thrive when the economy is strong and growing. Think Financials, Industrials, Materials, and Consumer Discretionary.
- Defensive (Low Sensitivity): These sectors provide goods and services that people need regardless of the economic environment. Think Consumer Staples, Health Care, and Utilities.
- Growth/Inflation Sensitive: These sectors have unique drivers. Technology can perform well in the mid-cycle as companies invest, while Energy often shines in the late cycle as inflation peaks.
The following table gives a fantastic high-level overview of the sector rotation playbook.

Now, let's use the Fidelity report again to understand the why behind this playbook.
[PDF] The Business Cycle Approach to Equity Sector Investing
This is the core of the lesson. You will now read the detailed breakdown of sector performance in each of the four phases.
Read the four sections detailing the performance patterns for the Early cycle, the Mid-cycle, the Late-cycle, and the Recession. For each phase, focus on which sectors lead and which lag, and connect this to the economic characteristics of that phase we just discussed.
Let's synthesize what you've read into an operator's mental model:
-
Early Cycle Leaders: Financials, Real Estate, Consumer Discretionary, Industrials.
- Why? These sectors are highly sensitive to interest rates and economic optimism. As rates fall and credit eases, borrowing becomes cheap, stimulating demand for big-ticket items like houses and cars (benefiting Financials, Real Estate, and Discretionary). As activity rebounds, Industrials get a boost.
-
Mid-Cycle Leaders: Information Technology often takes leadership.
- Why? The economic expansion is now stable, giving corporations the confidence to ramp up capital expenditures on software, hardware, and services. Performance leadership can be more mixed in this long phase.
-
Late-Cycle Leaders: Energy, Materials, Health Care, Consumer Staples.
- Why? A clear shift occurs. As inflation accelerates, commodity-linked sectors like Energy and Materials outperform. At the same time, as investors anticipate a slowdown, they rotate into defensive sectors like Health Care and Consumer Staples, which have stable earnings.
-
Recession Leaders: Consumer Staples, Utilities, Health Care.
- Why? These are the classic "safe havens." Economic activity is contracting, but demand for electricity, medicine, and food remains constant. Their stable earnings and often high dividend yields provide a defensive cushion.
From Theory to Practice: Reading the Signs in Real-Time
Knowing the model is one thing. Applying it is another. How do you diagnose the current phase of the cycle? You look for clues in the market itself and in key economic data.
This requires a multi-dimensional approach, as demonstrated by Julius de Kempenaer of StockCharts TV. He uses Relative Rotation Graphs (RRGs) to visualize sector leadership and combines this with an analysis of key economic indicators.
Market Past Top Shifting Towards Early Recession | Julius de Kempenaer | Sector Spotlight (04.12.22)
This video is a masterclass in applying the sector rotation model to real-time market data. You'll see how a professional analyst synthesizes various inputs to form a conclusion about the market's current position in the cycle.
First, watch from the beginning of the sector analysis. Notice how he identifies the strength in defensive sectors (Staples, Utilities, Health Care) and weakness in offensive/cyclical sectors (Tech, Discretionary). This is a classic late-cycle signal. Next, watch the segment where he analyzes the four key economic metrics: consumer expectations, industrial production, interest rates, and the yield curve. See how he maps the status of each metric to a specific phase of the cycle. Finally, watch his synthesis and conclusion. He combines the sector leadership data with the economic metrics to conclude that the market has passed its top and is moving toward an "early recession" phase. This is the thought process you need to cultivate.
From Analysis to Action: Using the Tools
Once you have a hypothesis about the current cycle phase, you can use modern brokerage tools to act on it. Many platforms provide their own business cycle analysis to help guide investors.
This short tutorial shows how to use Fidelity's tool to go from a macro view to a specific investment idea.
How to Invest Using Fidelity's Business Cycle Analysis
This video provides a simple, practical workflow for implementing a sector rotation strategy.
Watch how the presenter navigates to the business cycle analysis tool on the Fidelity platform. Then, see how he uses the tool to identify the current cycle phase (Late Expansion) and the sectors that historically outperform. Finally, observe how he uses a stock screener to find specific large-cap companies within the recommended Consumer Staples sector.
This simple workflow—Identify Phase -> Find Outperforming Sectors -> Screen for Strongest Companies—is a repeatable process you can add to your own toolkit.
Conclusion
You have now connected all the major macro dots into a single, powerful framework. You understand that the market leads the economy, that the economy moves through four distinct phases, and that sector leadership rotates in a predictable pattern throughout this cycle. This is not guesswork; it is a probabilistic strategy based on decades of historical data.
Key Takeaways:
- The Market Leads: The stock market cycle peaks and troughs 6-9 months ahead of the economic cycle.
- The Four Phases: The business cycle consists of Recovery (Early), Expansion (Mid), Slowdown (Late), and Recession. Each has unique economic drivers.
- The Sector Playbook:
- Early Cycle: Financials, Industrials, Consumer Discretionary lead.
- Mid-Cycle: Tech often takes over.
- Late Cycle: Energy, Materials, and Defensives (Health Care, Staples, Utilities) lead.
- Recession: Defensives dominate.
- Real-Time Diagnosis: You can assess the current phase by observing sector leadership rotation and tracking key economic indicators like the yield curve and consumer confidence.
We have now established a framework for how markets behave under "normal" cyclical conditions. But what happens when the script is thrown out the window? In our next lesson, we will explore Geopolitical and Macro Shock Risk—unforeseen events like wars, pandemics, and supply chain collapses that can override the cyclical playbook and reprice everything in an instant.