Welcome to the second module of your training. In the last module, we deconstructed the psychological traps that ensnare most market participants. We established that narrative addiction—the urge to believe a compelling story over hard data—is one of the most destructive bugs in the retail trader's operating system. Now, we begin installing the software to patch it. That software is accounting.
This lesson marks your first deep dive into the language of business. We are moving from the "why" of market psychology to the "what" of company performance. Your objective is to dissect an income statement to understand how a company truly makes money, to gauge its efficiency through its margins, and, most importantly, to learn how to spot where a business is quietly bleeding cash or hiding weaknesses. This isn't a bookkeeping exercise; it's forensics.
The Income Statement: A Company's Performance Report
At its core, the income statement tells a story. It's a report card that shows a company's financial performance over a specific period, like a quarter or a year. It answers the fundamental question: "Did the business make a profit?" In the long run, a company's stock price tends to follow its ability to generate and grow earnings.
To begin, let's establish this foundational concept.
The Only Fundamental Analysis Video You Will Ever Need... (Full Course: Beginner to Advanced)
This segment from "The Only Fundamental Analysis Video You Will Ever Need..." by Henry Chien clearly illustrates the relationship between a company's earnings and its stock price over time.
Watch the section from the introduction to earnings. Notice the charts for Apple, Nvidia, and Tesla. While the correlation isn't perfect in the short term, the long-term trend is undeniable: price follows earnings.
Now, let's build an income statement from its first principles. We'll use a simple analogy to understand the core components before applying them to real companies.
The Only Fundamental Analysis Video You Will Ever Need... (Full Course: Beginner to Advanced)
The same video provides an excellent, intuitive breakdown using a coffee shop example. This will build your mental model of how each line item connects to the next.
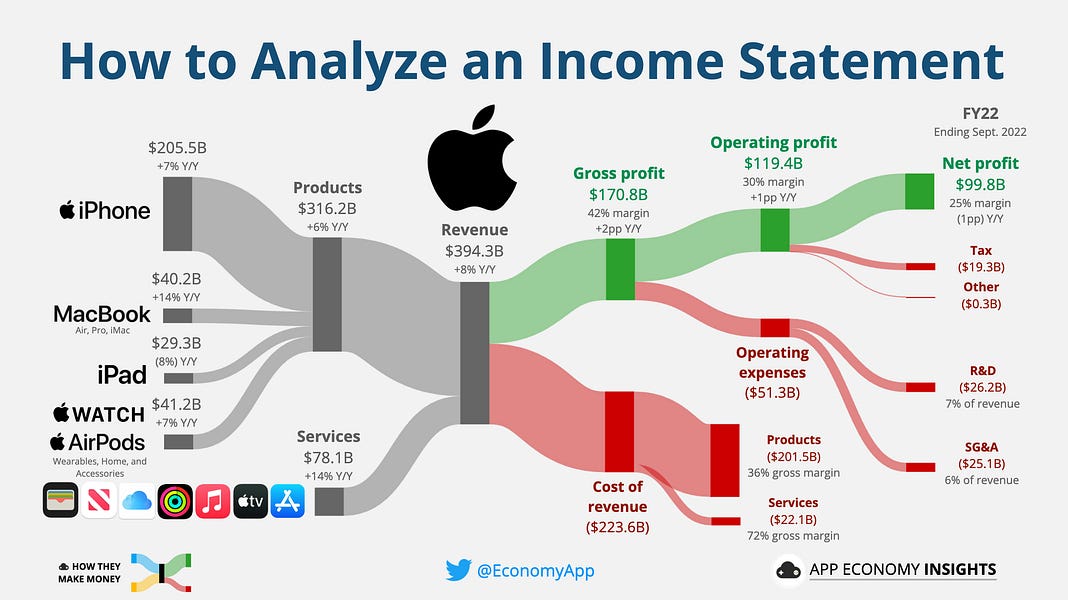
Watch the segment from building the income statement. Focus on the logical flow: Revenue (or Sales): The total money that comes in. Cost of Goods Sold (COGS): The direct costs of producing what you sold (e.g., coffee beans, cups). Gross Profit: Revenue minus COGS. This is the profit on the product itself. Operating Expenses (OpEx): Costs to run the business, not directly tied to a single product (e.g., staff salaries, rent, marketing). Operating Profit (EBIT): Gross Profit minus OpEx. This shows the profitability of the core business operations. EBIT stands for Earnings Before Interest and Taxes. Net Income (or Profit): What's left after paying for everything, including interest on debt and taxes. This is the "bottom line."
This flow from the "top line" (Revenue) to the "bottom line" (Net Income) is universal. Look at this visualization of Apple's 2022 income statement. You can see the exact same structure at a massive scale.
The Operator's Toolkit: Trend and Vertical Analysis
Simply reading the numbers isn't enough. An analyst's edge comes from adding context. The two primary techniques for this are trend analysis and vertical analysis.
- Trend Analysis (Horizontal Analysis): You compare the numbers in one period to the numbers in a previous period (e.g., this year vs. last year). This tells you about growth and direction. Is revenue growing? Are costs growing faster than revenue?
- Vertical Analysis: You express every line item on the income statement as a percentage of total revenue. This reveals the company's cost structure and profitability profile. For example, knowing COGS is 60% of revenue tells you far more than knowing COGS was $60 million.
These techniques allow you to quickly diagnose a company's health, a skill you wanted to develop for "reading earnings in 5 minutes." The next video demonstrates precisely how a professional would set this up.
How to Analyze The Income Statement like a CFO
The video "How to Analyze The Income Statement like a CFO" by The Financial Controller provides a masterclass in these techniques. It's a practical guide to building an analytical framework.
Watch the following sections carefully: First, watch the introduction to trend and vertical analysis. Next, see how to set this up in practice from building the analysis. Your IT background means the Excel formulas will be trivial, but focus on the logic of why revenue is used as the fixed base for vertical analysis. Finally, observe the powerful technique of using conditional formatting to create visual cues. This is a classic operator's trick to make problem areas jump off the page instantly.
The Interrogation: Finding Where the Business Bleeds
Now that you have the tools, we can begin the interrogation. The income statement presents a version of reality; your job is to stress-test it. We'll focus on margins and red flags.
Margin Analysis
Margins are the core indicator of profitability and competitive strength.
- Gross Margin (Gross Profit / Revenue): This reveals a company's pricing power and control over its direct production costs. A high and stable (or rising) gross margin is a sign of a strong business. A declining gross margin is a major red flag, suggesting rising costs or weakening pricing power.
- Operating Margin (Operating Profit / Revenue): This shows how efficiently the company runs its core operations. A rising operating margin indicates operating leverage—the desirable state where revenues are growing faster than operating costs, leading to accelerating profits.
Let's see this in action by comparing two real companies.
The Only Fundamental Analysis Video You Will Ever Need... (Full Course: Beginner to Advanced)
We return to Henry Chien's analysis, where he compares the income statements of Kroger and Walgreens. This is a perfect case study in using margin trends to spot a weakening business.
Watch the comparison of Kroger and Walgreens from the initial analysis and then see how the trends played out from the follow-up. Pay close attention to how Walgreens' declining gross margin was an early warning signal, even when other numbers looked okay. Also, notice how Kroger's improving EBITDA margin (a proxy for operating margin) signaled growing efficiency.
Spotting Red Flags and Questionable Earnings
A savvy analyst treats reported earnings with professional skepticism. Management has incentives to present results in the best possible light. Your job is to look for signs of weakness or manipulation.

Let's arm you with a framework for spotting these issues.
How to Tell If Earnings Growth Is Real or Fake for Growth Stocks
This article from TIKR provides a sharp, practical guide to questioning the quality of reported earnings.
Focus on these two critical sections: Read Margin Expansion. This section teaches you to question why margins are improving. Is it from genuine efficiency, or from cutting essential costs like R&D? Next, read Adjusted Earnings. This is crucial. Companies often report "Adjusted" or "Non-GAAP" earnings, which exclude certain costs to make results look better. Always ask: what are they excluding, and why? A growing gap between GAAP (the official number) and Adjusted earnings is a significant red flag.
The CFO video provides a final, conclusive example of this entire process, tying revenue slowdown, cost overruns, and margin compression together to show how a company can have growing sales but end up with a net loss.
How to Analyze The Income Statement like a CFO
We'll conclude with the analysis portion of the CFO video, which serves as a perfect summary of our interrogation process.
Watch from the line-by-line analysis. See how the analyst identifies specific problems: Slowing revenue growth. Cost of Sales growing faster than revenue, hurting gross margin. G&A expenses bloating, hurting operating margin. How these issues combine to turn a profit into a loss, despite rising revenue. This is a classic example of a business that is "quietly bleeding."
Conclusion
You have now built a foundational framework for dissecting an income statement. You've moved beyond simply reading numbers to actively analyzing them.
Your key takeaways are:
- Structure is Key: The income statement flows logically from Revenue to Net Income. Understanding this structure is the first step.
- Analysis Requires Tools: Trend (horizontal) and vertical analysis are your primary tools for putting numbers into context quickly and identifying meaningful changes.
- Margins Tell the Story: Gross margin reflects product strength, while operating margin reflects operational efficiency. Changes in these margins are critical signals about the health of the business.
- Maintain Professional Skepticism: Earnings can be managed. Always question the quality of growth, investigate "adjustments," and look for red flags where costs are outpacing revenue.
In our next lesson, we will turn our attention to the Balance Sheet. The income statement shows performance over a period of time, but the balance sheet provides a snapshot of what a company owns and owes at a single point in time. As you will see, many of the clues to a weak income statement are hidden in plain sight on the balance sheet.