Introduction
In our last lesson, we established the principle of the Margin of Safety—the crucial buffer between a company's intrinsic value and the price you're willing to pay. This buffer is your defense against an uncertain future and, more importantly, against the inherent imperfections in your own valuation. But to truly manage risk like a professional, you must understand precisely where your valuation is most fragile. Which assumptions, if you get them wrong, will cause the most damage?
This lesson transitions from defending against uncertainty to actively mapping it. You will learn to conduct a sensitivity analysis, a systematic stress test of your valuation model. We will move beyond a single point estimate of value and instead create a probabilistic map of potential outcomes. By the end of this lesson, you will be able to identify the most critical drivers of a company's value and understand what assumptions are currently "priced in" by the market—a key step toward developing the operator's instinct you're aiming for.
From a Point Estimate to a Probabilistic Range
A DCF model produces a single, precise-looking number for intrinsic value. This is an illusion. That number is the output of a function with numerous input variables: revenue growth, operating margins, capital expenditures, the terminal growth rate, and the Weighted Average Cost of Capital (WACC). An amateur presents this single number as "the answer." A professional knows it's merely the center of a wide range of possibilities.
The real task isn't to find the one "correct" set of inputs, but to understand how the final valuation changes as those inputs vary. This is the essence of sensitivity analysis. It's the financial equivalent of stress-testing a system: you systematically tweak the inputs to see where the model breaks or behaves unexpectedly.
While you can test any assumption, the two most powerful levers in a DCF model are typically the discount rate (WACC) and the terminal growth rate. Small changes in these two variables can cause massive swings in the final valuation because they affect the present value of all future cash flows, especially the terminal value which often represents a large portion of the total.
Visualizing Uncertainty: The Two-Way Sensitivity Table
The most common tool for this analysis is a two-way sensitivity table (or data table). This matrix shows how the output (e.g., enterprise value or share price) changes as two key inputs (e.g., WACC and growth rate) are varied simultaneously.
Look at the following table. It shows the implied share price from a DCF analysis at various combinations of a discount rate and a terminal growth rate.
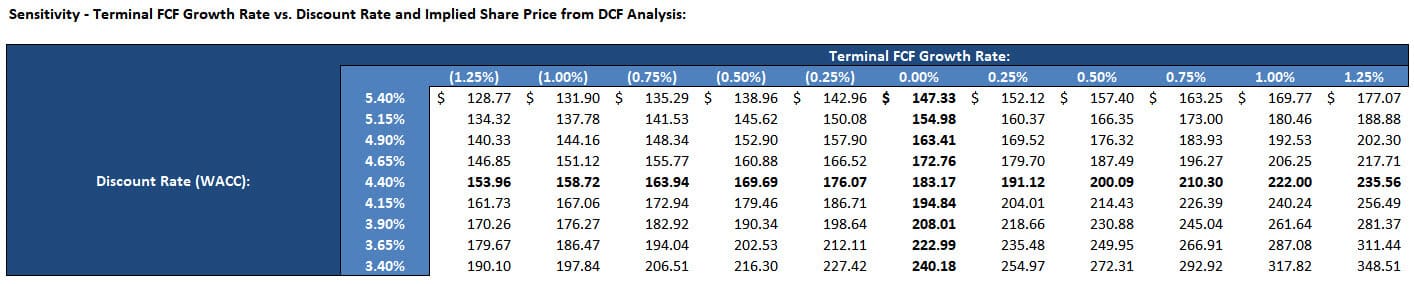
This table transforms a single valuation point into a landscape of possibilities.
- The Best Case: The bottom-right corner (low WACC, high growth) shows the most optimistic valuation.
- The Worst Case: The top-left corner (high WACC, low growth) shows the most pessimistic valuation.
- The "Priced-In" Case: If the company's current stock price is, say, $150, you can scan the table to see what combination of assumptions the market is currently using. For instance, the market might be pricing in a 5.15% WACC and a 0.25% terminal growth rate. If your own analysis suggests the growth rate should be 1.0%, you've just identified a potential mispricing.
Building the Analysis in Excel
Given your background in IT, you'll find the process of building these tables in Excel quite intuitive. It involves using Excel's built-in "Data Table" functionality. The following resources provide a detailed guide.
DCF – Sensitizing for Key Variables
This article from Financial Edge explains exactly why sensitivity analysis is non-negotiable for any serious DCF model.
Read the introduction under What is Sensitizing, followed by the Key Learning Points and the section on The Need for Sensitizing. This will ground you in the professional rationale for this exercise.
Now, let's get into the mechanics. The following video gives a clear, concise walkthrough of creating a two-way data table.
DCF Analysis Part 4: Final Valuation - and Sensitivity Analysis!
This video from Ric Thomas provides a practical demonstration of building and interpreting a sensitivity table for a DCF valuation of Walmart.
First, watch how the assumptions are set up and the table structure is created from this point. Next, observe the step-by-step process of using the 'Data Table' feature from this section. Pay close attention to how the 'Row input cell' and 'Column input cell' are selected. Finally, and most importantly, see how the output is interpreted from this segment. The key technique here is looking for the current market price within the table to understand what the market is implying about the company's future.
Avoiding Common Pitfalls
Like any powerful tool, Excel's data tables have quirks that can trip up the unwary. Knowing these is part of the "operator's edge." An incorrect analysis is worse than no analysis at all.
DCF – Sensitizing for Key Variables
The same article from Financial Edge has an excellent section on common errors. This is crucial knowledge.
Carefully read the entire section on Data Tables: Common Pitfalls. This covers issues like linking variables from other sheets, Excel calculation settings, circularity from linking the 'middle' variable, and rounding errors. Understanding these will save you from making critical mistakes.
The process described is the standard for a two-way sensitivity analysis. For a more detailed, step-by-step guide on the setup, you can refer to the How to Create a Data Table section in the Financial Edge article or watch this quick supplementary video.
Sensitivity Tables in Excel - Financial Modeling, Investment Banking, Private Equity, LBO
This video provides another clear demonstration, reinforcing the core mechanics of setting up and running a data table.
Watch the segment explaining the table structure and then the walkthrough of the Data Table function.
Beyond Two Variables: Finding the True Drivers
While WACC and terminal growth are the usual suspects, what if the valuation is even more sensitive to your revenue growth forecast or margin assumptions? A two-way table can't answer this. To do that, we need a different type of sensitivity analysis to rank the impact of all key assumptions.
This is often visualized using a Tornado Chart. The chart stacks the impact of changing each variable, with the most impactful variable at the top, creating a tornado-like shape.
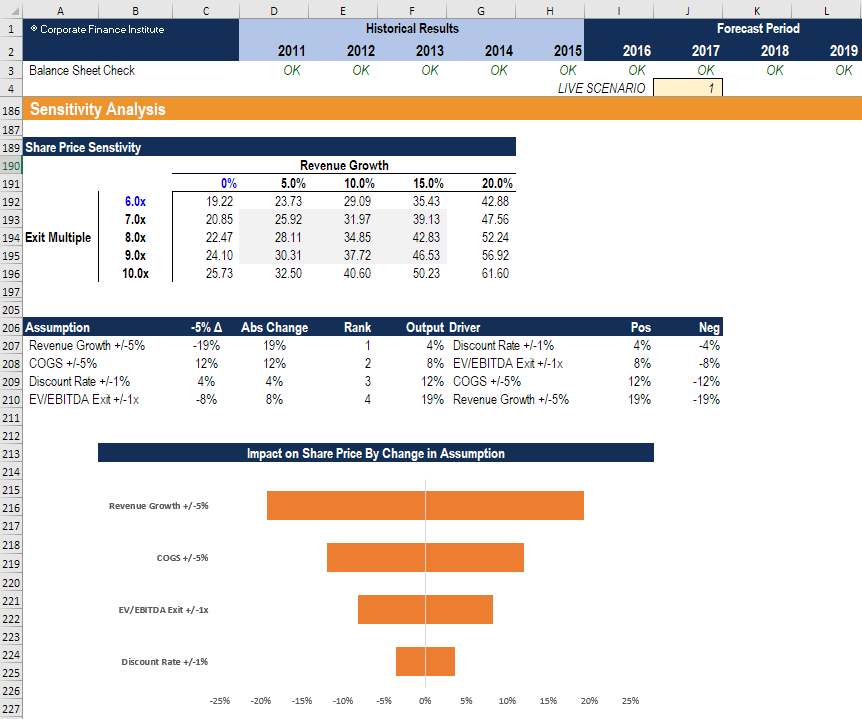
This chart answers the question: "What do I really need to be right about?" In the example above, being wrong about the revenue growth assumption by 5% has a far greater impact on the share price than being wrong about the discount rate by 1%. This tells you where to focus your research and due diligence. If revenue growth is the most sensitive driver, you should spend most of your time understanding the company's sales pipeline, market share trends, and competitive landscape, rather than endlessly debating whether the WACC should be 8.5% or 8.7%.
Conclusion
This lesson completes your toolkit for establishing what a business is worth. You've moved from calculating a single point estimate to defining a Margin of Safety, and now, to mapping the entire landscape of probable values with sensitivity analysis.
Key Takeaways:
- A Single Value is a Lie: A DCF valuation is not a single number but a range of possibilities dependent on your assumptions.
- Map the Possibilities: Sensitivity analysis, particularly with two-way data tables, is the standard professional method for visualizing this range.
- Identify Critical Drivers: The ultimate goal is to understand which 1-2 assumptions have the most leverage on your final valuation. Tornado charts are an excellent tool for this.
- "Back-Solve" the Market: By finding the current stock price within your sensitivity table, you can infer the assumptions the market is using, providing a powerful baseline for your own analysis.
You are now equipped to not only build a valuation but to defend it, understand its weaknesses, and know where it is most likely to be wrong.
In our next module, we zoom out. Having mastered the valuation of an individual company based on its internal financials and prospects, we will explore Macroeconomics. You will learn how the big-picture forces—interest rates, inflation, and economic cycles—systematically influence the very growth rates and discount rates that you now know are the critical drivers of value.