Introduction
In our last lesson, we forged the tactical rules of survival for individual trades, establishing a non-negotiable process for setting stop-losses and take-profits. This disciplined approach is designed to manage risk at the micro-level, ensuring no single mistake can take you out of the game.
Today, we elevate our perspective from the individual battle to the entire campaign. A series of trades, or a strategy, generates a stream of returns. But raw profit and loss figures are for amateurs. They tell you if you made money, but not how. Did you achieve those returns through genuine skill and a robust process, or were you just riding a wave of luck in a high-risk, fragile strategy that was one bad day away from imploding?
This lesson is about learning to score the game like a professional. We will move beyond crude P&L and learn to evaluate portfolio performance using risk-adjusted metrics. You will master the Sharpe Ratio, the industry-standard measure of efficiency, and the Maximum Drawdown, the brutal and honest metric of survival. By the end, you won't just see a return percentage; you'll see the quality, the stability, and the true cost of that return, allowing you to distinguish a truly superior strategy from a dangerous gamble.
Part 1: Why Raw Returns Are Misleading
Imagine two trading strategies, both delivering a 40% return over a year. An amateur would call them equal. An operator knows to ask deeper questions. What if one strategy's equity curve was a smooth, steady climb, while the other involved a terrifying 30% plunge midway through before recovering? The final return is the same, but the journeys were vastly different. The second strategy was more painful to endure, harder to trust, and exposed you to a greater risk of ruin if you needed to withdraw funds at the worst possible moment.
This concept of "wiggles" in the equity curve is the intuitive representation of risk, or volatility. A strategy with more violent swings is riskier. A professional performance metric must account for this.
The Sharpe Ratio Explained (by a quant trader)
The video "The Sharpe Ratio Explained" from the Wall Street Quants channel provides an excellent visual intuition for this concept. It frames risk as "Wiggles" in the return graph.
Watch the first few minutes, from the beginning until the introduction of the Sharpe ratio formula. Pay close attention to the comparison of the green and black investments. They have identical returns, but the video clearly explains why the 'wigglier' path of the black investment is inferior due to psychological pain, lack of confidence, and liquidity risk. Then, see how this is quantified in the segment on standard deviation.
The key takeaway is that return alone is a single, often deceptive, data point. A true evaluation of performance must create a ratio of the reward you gained to the risk you took to get it.
Part 2: The Sharpe Ratio - The Industry Standard for Efficiency
The Sharpe Ratio, developed by Nobel laureate William F. Sharpe, is the classic tool for this job. It distills performance into a single number that represents risk-adjusted return, allowing for a fair comparison between different strategies and assets.
The formula is conceptually elegant:
Where:
- is the average return of the portfolio.
- is the risk-free rate (the return you could get with zero risk, e.g., from a government bond).
- is the excess return, or risk premium. This is your reward for taking on risk.
- is the standard deviation of the portfolio's returns (its volatility or "wiggles"). This is the amount of risk you took.
The Sharpe Ratio, therefore, answers the question: "How much excess return did I get for each unit of risk I took on?"
The Sharpe Ratio Explained (by a quant trader)
Let's return to the "Wall Street Quants" video for a concise breakdown of the formula and its practical interpretation.
Watch the section that formally introduces the Sharpe Ratio. Note the benchmarks provided: the S&P 500's long-term Sharpe is below 0.5, Warren Buffett's is around 0.75, and good hedge funds aim for 2.0+. This context is critical for understanding what constitutes strong performance.
While the concept is simple, its correct application requires precision, especially regarding the time frame of your data. This is where we go a level deeper than most retail traders.
Risk, Return, and Sharpe Ratios
This article provides a more rigorous, quantitative breakdown of the Sharpe Ratio, perfect for your background. We'll focus on the section that deconstructs the metric.
Read Section 3: Deconstructing the Sharpe Ratio. Pay close attention not just to the formula, but to the subsection on annualization. Understanding the sqrt(N) rule and its underlying assumption that returns are independent and identically distributed (i.i.d.) is a professional-grade insight. Amateurs blindly apply the formula; pros question its assumptions.
Part 3: Maximum Drawdown (MDD) - The Survival Metric
The Sharpe Ratio is a powerful measure of efficiency, but it has a major blind spot: it relies on standard deviation, which penalizes all volatility equally. It doesn't distinguish between a pleasant 5% upward surge and a terrifying 5% plunge. Furthermore, it measures the average deviation, not the single worst period of pain.
This is where Maximum Drawdown (MDD) comes in. MDD is the most honest metric. It answers one brutal question: "What is the largest percentage loss my portfolio suffered from a peak to a subsequent trough?"
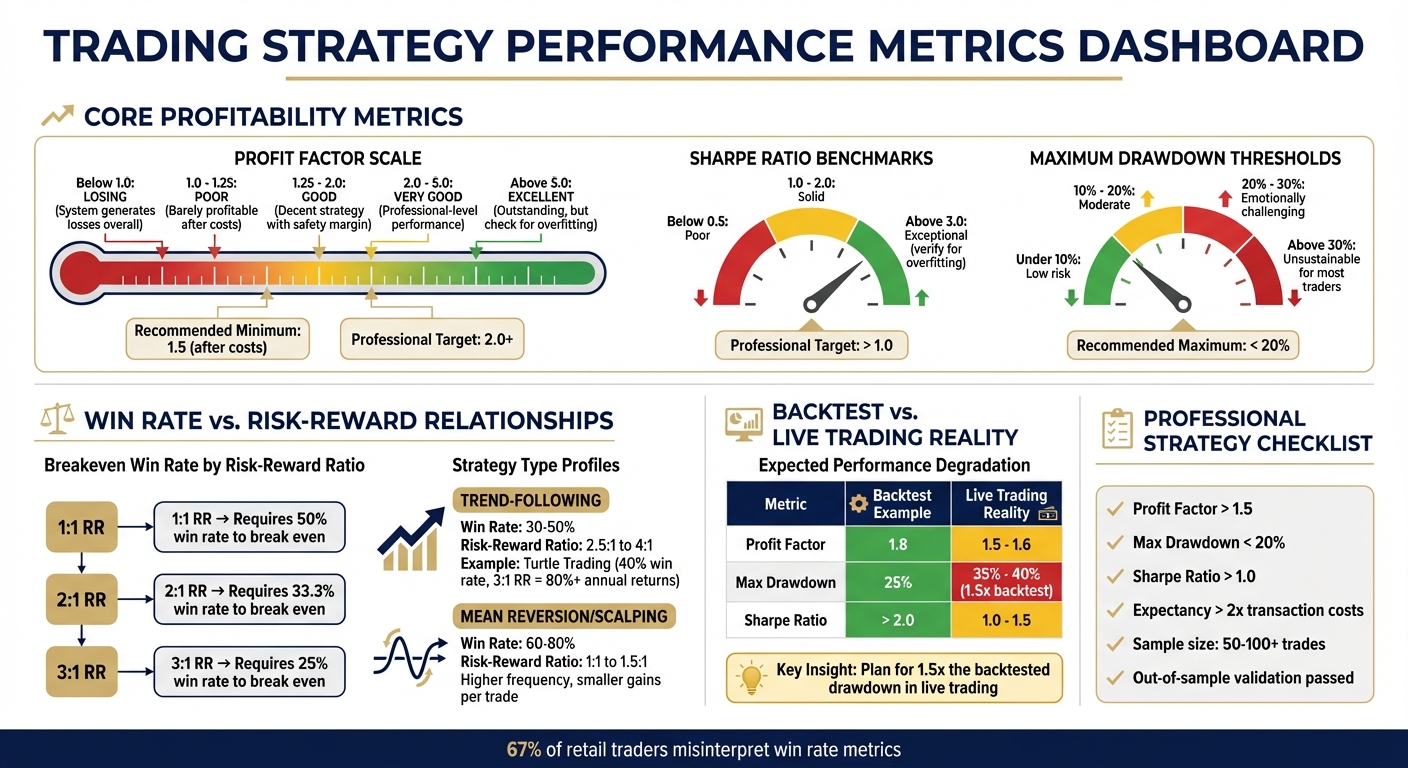
MDD isn't just a number; it's a measure of survivability. A strategy with a 60% MDD might look great on a backtest, but very few human beings can psychologically withstand watching their capital get cut by more than half without panicking and abandoning the strategy at the worst possible moment.
Maximum Drawdown in Trading: Risk Guide for Traders
This guide from Zaye Capital Markets is an excellent, no-nonsense explanation of MDD and its importance.
First, read the section "The Core Concept" to get the precise definition and a clear calculation example. Then, read the crucial section "Why Maximum Drawdown Matters". Internalize the table on Recovery Asymmetry. This non-linear math is why risk management is paramount.
Losing 50% means you need to gain 100% just to get back to where you started. This is the mathematical law that governs survival in markets. MDD is the single best measure of the "hole" you might have to dig yourself out of.
Part 4: A More Complete Toolkit
As you've seen, Sharpe and MDD measure different things. Sharpe measures the efficiency of your returns, while MDD measures the pain. A professional uses both, along with other related metrics, to build a complete picture.
The Sortino Ratio: A Smarter Sharpe
The Sortino Ratio is a refinement of the Sharpe Ratio. It modifies the formula to only penalize downside volatility. Upside volatility is good, so why should it count against you? The Sortino Ratio replaces standard deviation in the denominator with downside deviation, which only considers returns that fall below a target (usually the risk-free rate).
The Calmar Ratio: A Practical Alternative
The Calmar Ratio directly connects return to the pain of drawdown. Its formula is simple:
This metric is highly practical because it directly answers: "How much annual return am I getting for the worst pain I had to endure?" For many traders, this is a more intuitive and useful measure than the Sharpe Ratio.
Maximum Drawdown in Trading: Risk Guide for Traders
Let's revisit the Zaye Capital Markets article to learn about the Calmar Ratio.
Read the section titled "Maximum Drawdown and the Calmar Ratio". Note the example comparing Strategy A and B. Strategy B, with a lower absolute return but a much higher Calmar ratio, is vastly superior for any real-world operator.
Part 5: The Operator's Mindset: Skepticism and Stability
Having a high Sharpe, high Calmar, and low MDD in a backtest is a great start. But it is not enough. Historical performance metrics are, by their nature, backward-looking. The real world introduces challenges that can cause a strategy's live performance to be much worse than its backtested performance.

This is just one of many potential pitfalls. Overfitting, transaction costs, and look-ahead bias can all pollute your results. The ultimate test of a strategy is not the absolute value of its metrics in a backtest, but the stability of those metrics when deployed in a live environment. A strategy with a backtested Sharpe of 2.5 that degrades to 0.5 in live trading is a failure. A strategy with a backtested Sharpe of 1.8 that maintains a live Sharpe of 1.6 is robust and valuable.
Why Trading Metrics are Misleading (Unless This is True)
This video from Roman Paolucci makes a crucial point about the limits of these metrics. He argues that while they are necessary, they are not sufficient.
Watch the section from "less useless" measures to see a comparison of two strategies and how Sharpe, Sortino, and MDD help differentiate them. Then, watch the most important part, where he discusses the concept of stability. This is the ultimate goal: finding an edge whose performance characteristics remain stable in a forward-looking sense.
Conclusion
You have now moved beyond the simplistic world of raw returns and entered the professional domain of risk-adjusted performance evaluation. You understand that a return figure is meaningless without knowing the risk taken to achieve it.
Key Takeaways:
- Raw returns are for storytellers; risk-adjusted returns are for operators. The quality of returns matters more than the quantity.
- The Sharpe Ratio is the industry standard for measuring the efficiency of a strategy (return per unit of volatility). Aim for strategies with a Sharpe ratio greater than 1.0, with 2.0+ being the goal for exceptional performance.
- Maximum Drawdown (MDD) is the ultimate survival metric. It measures the worst peak-to-trough loss and is a powerful indicator of the financial and psychological pain a strategy can inflict. Keeping MDD within tolerable limits (e.g., <20%) is paramount.
- A professional uses a dashboard of metrics, including the Sortino Ratio (for downside risk) and the Calmar Ratio (return over max drawdown), to build a complete, multi-faceted view of performance.
- The ultimate test is stability. A strategy's value is determined not by its backtested metrics, but by its ability to maintain similar performance characteristics in a live, forward-looking environment.
In our next lesson, we will put this knowledge to use. Now that you can measure the characteristics of a high-quality portfolio, we will explore the practical frameworks professionals use to construct them, such as core-satellite, barbell, and factor-based approaches.