Introduction
In our last lesson, we uncovered the dangerous illusion of "diversification" by exploring hidden correlations—the invisible strings that can pull your entire portfolio down in a crisis. You now understand that a portfolio's safety isn't measured by the number of stocks it holds, but by its resilience to systemic shocks.
Today, we confront the direct consequence of that risk: the drawdown. This isn't just about losing money; it's about the brutal, non-linear mathematics of recovery. The core objective of this lesson is for you to internalize one of the most fundamental laws of market survival: why losing 50% of your capital requires a 100% gain just to get back to where you started. Mastering this concept is not optional. It is the bedrock of professional risk management and the primary filter that separates traders who last from those who blow up.
The Asymmetric Reality of Loss
Your intuition might tell you that a 10% loss can be fixed by a 10% gain. This linear thinking is one of the most expensive mistakes a new market participant can make. The reality is that gains are calculated on your remaining, smaller capital base, while losses were calculated on your original, larger one.
Drawdown Recovery Math: Why a 50% Loss Needs a 100% Gain | FXNX
This article from FXNX cuts directly to the heart of the issue with a simple, powerful example.
Read the first half of the article, from the beginning down to the section "Beyond Numbers." Focus on the $10,000 account example to see how a 50% loss necessitates a 100% gain.
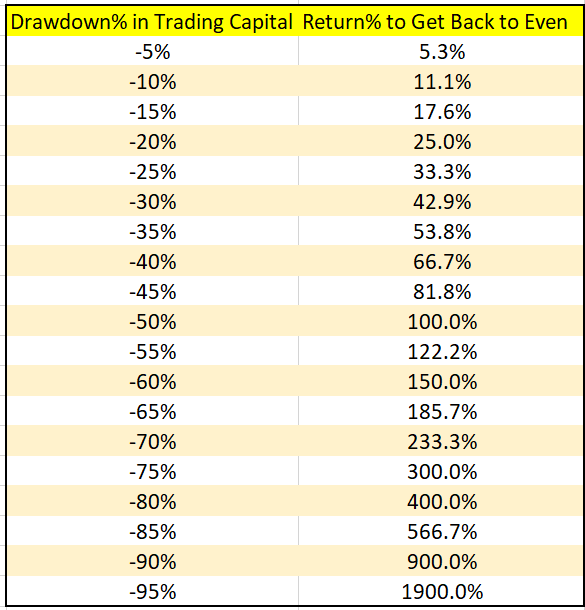
The relationship between the depth of a loss and the required gain for recovery is not linear; it is exponential. As drawdowns get deeper, the path back becomes disproportionately steeper.
Take a moment to study these two visuals. They present the same unforgiving truth in different ways.

Why Does This Happen? The Mathematics of "Volatility Drag"
To truly internalize this concept, especially with your quantitative background, we need to go beyond the surface-level numbers and understand the underlying mathematical engine: volatility drag.
Volatility drag is the difference between an investment's arithmetic average return (what you might calculate in a simple average) and its geometric average return (the compounded return you actually experience in your account). The sequence of returns matters, and volatility is a persistent, mathematical headwind.
Shannon’s Demon & How Returns Can Be Created Out Of Thin Air — Richmond Quantitative Advisors
This article from Richmond Quantitative Advisors uses a coin-flip game to brilliantly explain the concept of volatility drag.
Read the section titled "So Why Does Shannon’s Demon Work?" Pay close attention to the example of a +10% gain followed by a -10% loss, which results in a 1% net loss. This is the simplest demonstration of volatility drag.
The core insight is that returns compound, and large swings (volatility) hurt compounding more than they help. The key formula provided in the article to approximate this relationship is:
Where the drag itself is a function of the square of volatility:
The fact that volatility is squared in this approximation is critical. It proves that the negative impact of volatility grows exponentially. Doubling the volatility of your returns doesn't double the drag; it quadruples it. This is the mathematical reason why a 50% loss is so much more destructive than two separate 25% losses. It's also why a smooth 10% annual return is vastly superior to a volatile path that averages 10% by gaining 40% one year and losing 20% the next. The latter path suffers from immense volatility drag, silently eroding your true compounded return.
Quantifying the Recovery Path
Instead of relying on a table, you can precisely calculate the gain required to recover from any drawdown. This transforms a vague fear into a concrete number, which is the first step toward managing it.
Drawdown Recovery Math: Why a 50% Loss Needs a 100% Gain | FXNX
Let's return to the FXNX article to get the exact formula.
Read the section "Empower Your Recovery." Memorize the formula and work through the examples.
The formula is:
\text{Recovery %} = \left( \frac{\text{Loss \%}}{1 - \text{Loss \%}} \right) \times 100Let's use it for the 50% loss scenario:
\text{Recovery %} = \left( \frac{0.50}{1 - 0.50} \right) \times 100 = \left( \frac{0.50}{0.50} \right) \times 100 = 1 \times 100 = 100\%As an exercise, calculate the recovery for a 33% drawdown. You will find it is approximately 50%. This inverse relationship is not a coincidence. This formula should become an instinctive part of your thinking, a constant reminder of the high cost of letting losses run.
The True Cost: Emotional and Strategic Destruction
The damage from a deep drawdown goes far beyond your account balance. It attacks your ability to operate effectively on two other fronts: your psychological state and your strategic positioning.
Maximum Drawdown: Risk Adjusted Return Series part 3
This video from Volatility Trading Strategies explains the broader consequences of max drawdown, introducing the critical concept of "emotional capital."
Watch the following segments: First, get the formal definition of maximum drawdown. Next, watch the explanation of the asymmetric recovery math, which reinforces what we've already covered. Pay close attention to the discussion on preserving emotional capital. Finally, understand how risk tolerance is not linear, and why the probability of abandoning a strategy skyrockets with deeper losses.
The key takeaways from the video are:
- Emotional Capital: A 50% drawdown doesn't just halve your money; it can destroy your confidence, discipline, and ability to make rational decisions. Trading from a position of fear and desperation leads to chasing losses and revenge trading—the fastest ways to zero.
- Non-Linear Risk Tolerance: The pain of losing money is not linear. The psychological jump from a -20% drawdown to -30% is far greater than from -10% to -20%. At a certain point, the pressure becomes unbearable, and investors "tap out"—often right before the strategy is about to recover.
Surviving in markets requires you to be in the game. A deep drawdown can force you out of the game, either financially or emotionally, preventing you from capturing the very recovery you're hoping for.
The Operator's Response: Dynamic Risk Management
Understanding the math is one thing; applying it under pressure is another. The amateur's response to a drawdown is to increase risk to "make it back fast." The professional's response is the exact opposite.
How to Trade Out of a Drawdown (Full Guide)
This guide from JadeCap provides a practical playbook for how to behave when you find yourself in a drawdown.
Watch these clips for actionable advice: The speaker confirms the core math: losing 50% requires 100% to recover. Now for the key strategy: Understand how reducing risk/leverage flatlines the equity curve, stops the bleeding, and buys you time to regain your footing. Finally, listen to a real-world example of the speaker recovering from a significant drawdown by being patient and managing risk dynamically.
The critical lesson here is dynamic risk management. When you are performing well, your risk can be normal. When you enter a drawdown, you must cut your risk. This is profoundly counter-intuitive but essential. By cutting your position size, you reduce volatility. As we learned from the volatility drag formula, reducing volatility has an exponential benefit. It stops the compounding of losses and gives you the one thing you need most: time. Time to analyze what went wrong, time to wait for better market conditions, and time for your emotional state to stabilize.
Conclusion
This lesson moved you from a simple understanding of profit and loss to a professional appreciation for the non-linear, unforgiving nature of risk. Your goal is not to avoid losses—they are an inevitable part of the business—but to avoid the catastrophic ones.
Key Takeaways:
- Recovery is Asymmetric: Losses require exponentially larger gains to break even due to the mechanics of compounding.
- Volatility Drag is the Enemy: High volatility, especially on the downside, is a mathematical poison to long-term returns. It creates a gap between your theoretical average return and your actual, take-home compounded return.
- Preserve Emotional Capital: Deep drawdowns make you a worse trader. They deplete your confidence and discipline, leading to poor decisions.
- Defense First: The primary job of a market operator is not to maximize gains, but to manage risk and preserve capital. The gains will take care of themselves. The professional response to a losing streak is to reduce risk, not increase it.
You now understand why deep drawdowns are so destructive. In our next lesson, "Stop Losses, Exit Rules, and Trade Management," we will build the practical toolkit to prevent them from happening in the first place. We'll move from theory to execution, designing the hard rules that protect your capital from both the market and yourself.