Welcome to the module on reading the VIX. An option’s implied volatility expresses what volatility is consistent with its market price; it is not a promise about what will happen. The VIX gathers information from many S&P 500 options and expresses it as one number. This lesson follows that construction—from option quotes to a constant 30-calendar-day, annualized volatility measure—without requiring the calculation formula.
Why use more than one option?
A single option has one strike price and one expiration date. Its price can tell us something about the market’s pricing of uncertainty, but it cannot represent the full range of possible S&P 500 outcomes. A put with a low strike, for example, responds to a different set of outcomes than a call with a high strike.
Start with Macroption’s VIX Calculation Explained. It gives a short overview before we turn to the index provider’s methodology.
VIX Calculation Explained - Macroption
Read Macroption’s overview to see why the calculation uses multiple option prices and two expirations. Treat its description of a “hypothetical option” as an interpretation of the resulting number, not as an option the VIX actually prices.
In “Basic Logic of VIX Calculation,” read the basic logic. Then, under “VIX Calculation Step by Step” and its “Options Included in VIX Calculation” subsection, read the step list and the expiration discussion. Focus on the distinction between combining prices across strikes and combining information across expirations.
The chart below illustrates why looking across strikes matters. Each curve shows that options with different strikes can have different implied volatilities on the same observation date. The chart is not a plot of VIX values, nor does it specify the expirations needed to calculate the VIX.
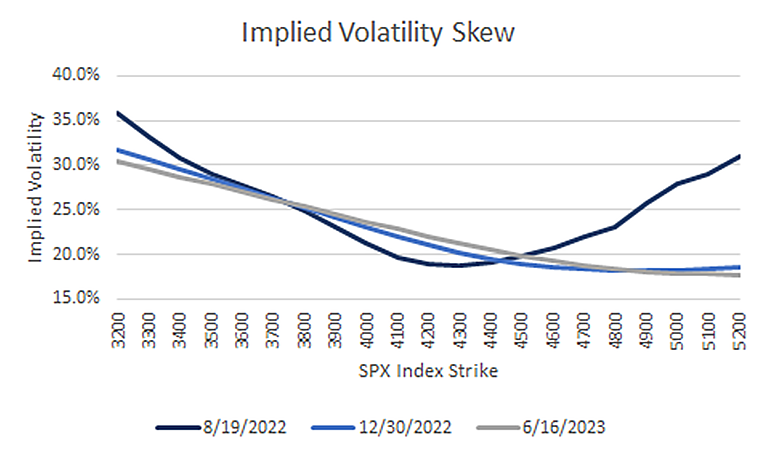
A tempting shortcut would be to average the implied volatilities shown along one curve. That is not how the VIX is calculated. Its inputs are selected option prices; each selected strike contributes to an estimate of variance according to the calculation’s rules. Variance is volatility squared. Working with variance is important both when combining strikes and, later, when combining expirations.
Which prices go in?
Cboe, the index provider, sets the selection rules in its Volatility Index Methodology. Its document contains a full formula, but the contract-selection description and four-step outline are enough for our purpose.
[PDF] Cboe Volatility Index Methodology
Read Cboe’s contract-selection rules and its plain-language calculation outline. The document is technical; you can skip the displayed formula and follow what each step accomplishes instead.
In Section 2.1, “Contracts Used and Selection Method” (around pp. 4–5), read the contract selection. Then go to Section 3.1, “VIX Index Calculation: Step-by-Step” (pp. 5–6). Start at “The VIX Index measures 30-day expected volatility of the S&P 500 Index” and read the four steps. Notice what is calculated separately for each expiration before the final 30-day value is formed.
The underlying contracts are S&P 500 index options, including eligible standard and weekly expirations. For each of two selected expirations, the VIX calculation uses a range of strikes. Broadly, it takes out-of-the-money puts below a strike near the option-implied forward index level and out-of-the-money calls above it; at the dividing strike, it uses both a put and a call. “Forward” here means the index level inferred for the expiration from option prices, rather than simply today’s displayed index level.
The calculation uses quoted option prices—specifically bid-ask midpoints for selected options—along with inputs such as time to expiration and interest rates. It combines the strikes to produce a variance estimate for each expiration. The strikes are not given equal weight, so “the VIX is the average implied volatility of SPX options” is a useful-sounding but inaccurate description.
The calls and puts both matter. Their inclusion does not mean the calculation votes on whether the market will rise or fall. Options at different strikes supply price information about different possible outcomes, which the calculation combines into a measure of anticipated variation.
How can the horizon stay at 30 days?
Options expire on particular dates; the VIX’s target horizon does not. Suppose the selected expirations are 26 and 33 calendar days away. Neither option set has exactly 30 days remaining. Cboe first obtains a variance estimate from the option prices at each expiration, then combines the two expirations’ information to target 30 days. The closer expiration and the later expiration supply information on either side of that target.
The key is that the calculation interpolates variance over time, not two quoted implied-volatility percentages. As days pass, the time remaining on both sets of options shrinks. The eligible expiration pair is updated under the index rules, allowing the published measure to keep targeting the next 30 calendar days rather than drifting toward the expiration of one fixed set of contracts.
“Constant 30-day” therefore describes the horizon of the measure, not a claim that the VIX number remains constant. It can change as option quotes change, even when the calendar-day target stays the same.
Why is a 30-day measure quoted at an annual rate?
Once the calculation has a 30-day variance estimate, it converts that variance to an annualized rate, takes its square root to express volatility rather than variance, and multiplies by 100 to produce the familiar index level. The index is thus quoted in percentage points: a VIX of 20 represents approximately 20% annualized 30-day implied volatility.
Two time descriptions are doing different jobs:
- 30 calendar days identifies the future window whose volatility is being assessed.
- Annualized identifies the convention used to quote that volatility.
A VIX of 20 does not say the S&P 500 is expected to move 20% over the next month. Nor does annualizing turn it into a direct forecast of the coming year: the option prices used here concern a near-term window. The next lesson will translate an annualized VIX reading into an approximate 30-day move scale.
Finally, “implied” deserves its usual caution. The VIX reflects volatility priced into the selected options under the index methodology. Realized volatility can differ. And because volatility concerns the size of variation, the number alone says nothing about whether shares will finish the period higher or lower.
Takeaway
The VIX combines S&P 500 call and put prices across selected strikes, estimates variance separately for two nearby expirations, and combines those estimates to maintain a 30-calendar-day horizon. It then quotes the resulting volatility at an annual rate. It is neither one option’s implied volatility nor a guaranteed forecast of the market’s path.
Next, you will use that annualized reading to estimate a 30-day move scale—and examine why that scale is not a guaranteed price range.