Welcome back. The previous lesson established that the VIX targets the next 30 calendar days but reports volatility at an annualized rate. That distinction matters when you see a headline such as “VIX at 20”: it does not mean the S&P 500 is expected to move 20% this month. Here you will convert that reading into an approximate 30-day move scale and learn what the resulting number can—and cannot—tell you.
From an annual rate to 30 days
Volatility describes a scale of variation, not a fixed amount by which an index must move. To adjust an annualized volatility figure to a shorter period, the usual approximation multiplies it by the square root of the fraction of a year in that period. Because the VIX uses a calendar-day convention, the 30-day calculation is:
The square-root factor is approximately . Thus a VIX of 20 gives:
This is a rough one-standard-deviation scale for the S&P 500 over 30 days, not a prediction that it will move exactly 5.7%.
Why the square root rather than simply dividing by 12? The scaling convention assumes that variance—volatility squared—accumulates roughly in proportion to time. Volatility is the square root of variance, so it scales with the square root of time. This is an approximation, not a rule that markets must obey.
Cboe’s article below demonstrates a similar conversion by treating a month as one-twelfth of a year. Read its monthly example alongside its explanation of the calendar-day convention; the slight difference between “one month” and exactly 30 days accounts for slightly different answers.
Read Scott Bauer’s Cboe article for a worked conversion from an annualized VIX reading to a shorter-period move scale. Keep the previous lesson’s 30-day horizon in mind as you read.
Under the article title, find the paragraph beginning “Although the VIX Index isn’t expressed as a percentage,” before the subsection “S&P 500 Index vs. VIX Index Implied Move.” Within it, read from “Calculating potential movement in the S&P 500 Index using the VIX Index on a shorter basis is a bit more complicated” through the weekly calculation ending “This implies a move of 3.88% over the next week.” Focus especially on the monthly conversion and why it divides by the square root of 12, not 12. Continue into the next paragraph, from “Since the VIX Index uses calendar day annualization” through “This implies a daily move of approximately 1.46%.” Use the day convention to check which annual-day count belongs in a VIX-based calculation. The article also illustrates a year-long range; do not treat today’s VIX as a direct forecast for the entire coming year, because its option inputs target a near-term window.
The article’s VIX-of-28 example gives about for one-twelfth of a year: . Using exactly 30 calendar days instead gives about : . Both are sensible approximations when their time conventions are stated.
Turning the percentage into index points
Suppose the S&P 500 stands at 5,000 and the VIX reads 24. For the next 30 calendar days, the approximate move scale is:
At an index level of 5,000, is about 344 index points. A shorthand band centered on today’s level would therefore be roughly 4,656 to 5,344.
That band helps put the VIX reading in perspective. It does not say that 4,656 and 5,344 are hard limits, that either endpoint is a target, or that the index will necessarily touch one of them. It is a scale for a possible end-of-period change, not a bound on every price reached along the way.
Notice also what the calculation did not require: choosing whether the index will rise or fall. The same percentage scale applies to moves in either direction. The next lesson will address why “fear gauge” headlines can obscure that distinction.
Why the band is not a guarantee
Under a simplified model with approximately normally distributed returns, a band of one standard deviation on either side of a central value would contain about 68% of end-of-period outcomes. Even within that model, roughly 32% would fall outside it. The shorthand band above also uses today’s index level as its center; it is not a precise probability interval extracted from option prices.
Real markets add further reasons for caution. Large moves can be more common than a simple normal model suggests, volatility can change during the month, and option prices reflect what market participants are willing to pay for exposure to uncertain outcomes—not a promise that future volatility will match today’s implied figure. The VIX calculation itself gathers prices across options; the simple symmetric band is an interpretation aid, not an output guaranteed by the index methodology.
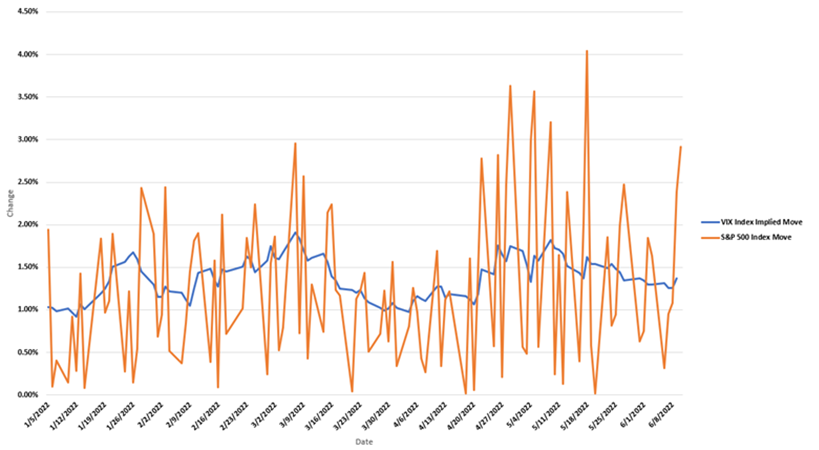
The chart below makes the distinction visible on a daily scale. Its blue line is a VIX-derived implied daily move; the orange line is the S&P 500’s actual daily percentage move in absolute value. On some days the actual move is much larger than the implied scale, while on others it is smaller. The chart is not a test of whether any particular 30-day band held, and a daily implied scale should not be mistaken for a daily maximum.
Takeaway
To translate a VIX reading into an approximate 30-calendar-day percentage move scale, multiply the reading by , or about 0.287. A VIX of 20, for example, corresponds to a scale of about 5.7%, not 20%, over that period. Treat any resulting band as a model-based way to understand the size of potential movement—not a guaranteed range, a prediction of an exact move, or a forecast of its direction.
Next, you will apply that distinction to “fear gauge” headlines and examine why the VIX’s tendency to rise during stock-market declines does not make it a directional prediction tool.