Hello. The previous lesson established that a scale measures total mass, not body fat: water, stored carbohydrate, and digestive contents can move the number quickly. This lesson turns that insight into a way to read several weeks of measurements. You will see how consistent conditions and averages make a trend easier to interpret, where uncertainty remains, and why using a scale is always optional.
Make measurements comparable before comparing them
An average cannot correct a measurement routine that changes from day to day. A morning reading before breakfast and an evening reading after meals reflect different amounts of food and drink in the body. Even the scale’s position can matter.
If you choose to weigh yourself, a workable routine is to use the same scale on a firm, level floor, at a similar time of day, with similar clothing. Morning, after using the restroom and before eating or drinking, is one way to reduce differences caused by the day’s meals. Consistency matters more than achieving perfect conditions. A missed morning or an unusual day need not become an obligation to weigh later; you can simply leave a gap in the record.
The Best Time To Weigh Yourself
Read Cleveland Clinic’s guidance to see which conditions make successive readings more comparable.
In “When should you weigh yourself?”, read the timing advice. Then, in “How to weigh yourself correctly,” read the measurement steps, paying particular attention to scale placement. Treat these as ways to improve comparison if you weigh yourself, not as a requirement to do so.
A record is most useful when its entries were collected in broadly similar circumstances. If a scale was moved from a hard floor to carpet halfway through a month, or most early readings were taken in the morning and later ones in the evening, note the change. It may be difficult to tell how much of the apparent trend reflects your body and how much reflects the measurement change.
Let an average describe the week, not any one day
The image below shows seven daily readings. Tuesday and Saturday are higher than several neighbouring days; Thursday is lower. Its dashed line marks the weekly average, about 66.3 kg. None of those individual bars has to equal the average for the average to be useful.
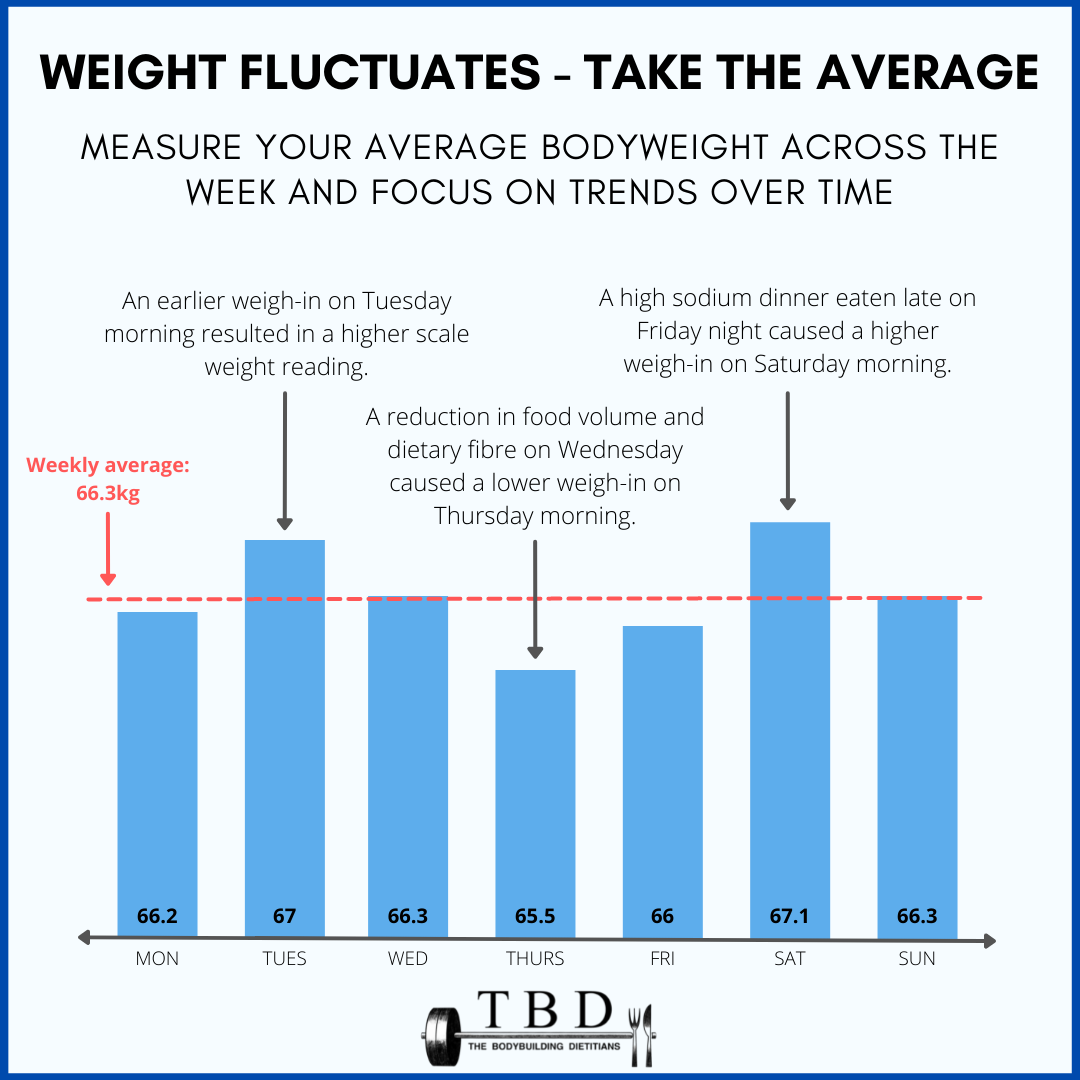
For a week with seven readings, add them and divide by seven. If there are fewer readings, divide by the number actually recorded, not by seven. A weekly average reduces the influence of an unusually high or low day, but it does not remove all variation. Several days of fluid retention, for example, could affect much of a week.
The following short segment demonstrates the calculation and why a single weekly check-in can give a different impression from the surrounding readings.
Weight Fluctuations | Educational Video | Biolayne
Watch “Weight Fluctuations” by Dr. Layne Norton for a demonstration of consistent weigh-ins and weekly means.
Watch weekly averages. Notice the example in which one check-in is higher even though the surrounding average has fallen. The speaker recommends daily weighing; take that as one possible method, not a requirement. His suggestion that average changes primarily reflect tissue should also be treated cautiously: averages can still be affected by water and other short-term factors.
Averages work best when the weeks being compared have reasonably similar coverage. Seven morning readings in one week and one evening reading in the next do not provide equally strong evidence. Weighing once weekly on the same day under similar conditions is an option, but a single reading leaves more room for an unusually high or low day to shape the comparison.
Read a multiweek record
Consider this hypothetical record, taken each morning under similar conditions. The entries are in kilograms.
| Week | Mon | Tue | Wed | Thu | Fri | Sat | Sun | Weekly average |
|---|---|---|---|---|---|---|---|---|
| 1 | 72.0 | 71.8 | 71.9 | 71.7 | 71.6 | 72.2 | 71.8 | 71.86 |
| 2 | 71.7 | 71.6 | 71.8 | 71.5 | 71.4 | 71.9 | 71.6 | 71.64 |
| 3 | 71.5 | 71.4 | 71.6 | 71.3 | 71.2 | 71.8 | 71.4 | 71.46 |
| 4 | 71.4 | 71.2 | 71.3 | 71.1 | 71.0 | 71.5 | 72.0 | 71.36 |
Week 1’s total is 503.0 kg across its seven readings, so its average is kg. Applying the same calculation to each week gives the final column.
Suppose the person looks only at Sundays. The last Sunday, 72.0 kg, is higher than the first Sunday, 71.8 kg. That comparison could make four weeks appear to show no downward movement. The weekly averages tell a different story: they decline from about 71.86 to 71.36 kg, a difference of about 0.50 kg between the first and fourth weeks.
The careful interpretation is that the recorded weight level appears to have moved downward across these four weeks, despite a high final reading. It is consistent with longer-term loss of body mass. It does not prove that exactly 0.50 kg of fat was lost, or establish why the last Sunday was high. Water balance, digestive contents, and other tissue changes remain part of what the scale measures.
MacroFactor’s explanation of weight trends makes a related distinction between a raw scale reading and the direction of several readings. It describes a moving average that gives more emphasis to recent measurements. You do not need that app or its particular calculation to use the principle: compare the pattern rather than treating two endpoints as the whole story.
Read MacroFactor’s help article for its explanation of why a trend can differ from today’s scale reading. Focus on the interpretation, not the app’s calorie recommendations.
In “FAQ,” find “Deep dive” and read the trend explanation. Then, in the passage below “Deep dive,” start at the hypothetical Sunday weigh-in and read the endpoint example. Notice how the readings around each Sunday change the meaning of the Sunday-to-Sunday comparison. The example is a warning against a drastic response to isolated readings, not a formula for changing your own intake.
Keep the conclusion proportional to the evidence
Weekly averages make a record more interpretable, not certain. The hypothetical record has four weeks of fairly complete, comparable measurements, so its downward pattern is more informative than either Sunday alone. If the last week instead contained only Sunday’s reading, calling that number a “weekly average” would add no information. Missing days should remain missing; do not invent readings to complete a week.
Context also matters when a pattern seems puzzling. The previous lesson covered how changes in water, glycogen, digestion, and the menstrual cycle can influence readings. Those effects do not necessarily disappear at a week boundary. Where menstrual-cycle effects are relevant, comparing periods of similar cycle timing across longer records may sometimes be more informative than interpreting one week’s change. No calculation can identify the exact composition of a weight change from scale readings alone.
Most importantly, a trend is information, not an instruction to restrict food. Whether a pattern calls for any change also depends on hunger, strength, recovery, physical symptoms, and your relationship with food—the subject of the next lesson. A sudden, substantial, unexplained change, especially with concerning symptoms, deserves professional assessment rather than an assumption that it is ordinary fluctuation.
For some people, weighing causes anxiety or encourages harmful restriction. In that case, it is reasonable to stop or avoid self-weighing. You can pay attention instead to how you are functioning—for example, energy, strength, recovery, and whether eating feels manageable—without replacing the scale with another compulsory body measurement. If weighing or eating behaviours are becoming distressing or difficult to control, seek support from a qualified professional.
The Best Time To Weigh Yourself
Return to Cleveland Clinic’s article for its qualification about when scale monitoring may not be helpful.
In the discussion after “How often should you weigh yourself?”, read the caution on weighing. Focus on its distinction between using a measurement as information and allowing it to drive anxiety or self-judgment.
Key takeaways
A multiweek record is easier to interpret when readings are taken under comparable conditions and weeks are compared using averages rather than isolated endpoints. An average can reveal a direction hidden by daily fluctuations, but it cannot separate fat from water or other components of body mass, and incomplete or inconsistent records deserve less confidence. Weighing remains optional.
In the next lesson, you will combine any available weight trend with hunger, strength, recovery, symptoms, and your relationship with food to decide whether a hypothetical plan should continue, change, return to maintenance, or prompt professional help.