In our previous lesson, we dove into metrics like the Sharpe, Sortino, and Calmar ratios. These are excellent for evaluating a strategy's overall risk-adjusted performance from a portfolio perspective. Now, we will shift our focus from the "big picture" to the "per-trade" level. This lesson concludes our foundational module by introducing two critical metrics you specifically asked about: Profit Factor and Strategy Expectancy.
These metrics are the bedrock of evaluating a strategy's health. They move beyond summary statistics to answer a more direct question: "Is my average trade profitable, and by how much?" Understanding this is fundamental before you commit capital to any system. By the end of this lesson, you will be able to calculate and interpret both the profit factor and expectancy, giving you a clear, quantitative edge in assessing any trading strategy you develop.
Profit Factor: The Ratio of Wins to Losses
The Profit Factor is one of the most straightforward and intuitive performance metrics. It directly compares the total money gained from winning trades to the total money lost from losing trades.
The formula is simple:
Where:
- Gross Profit is the sum of all profits from all winning trades.
- Gross Loss is the sum of all losses from all losing trades (expressed as a positive value).
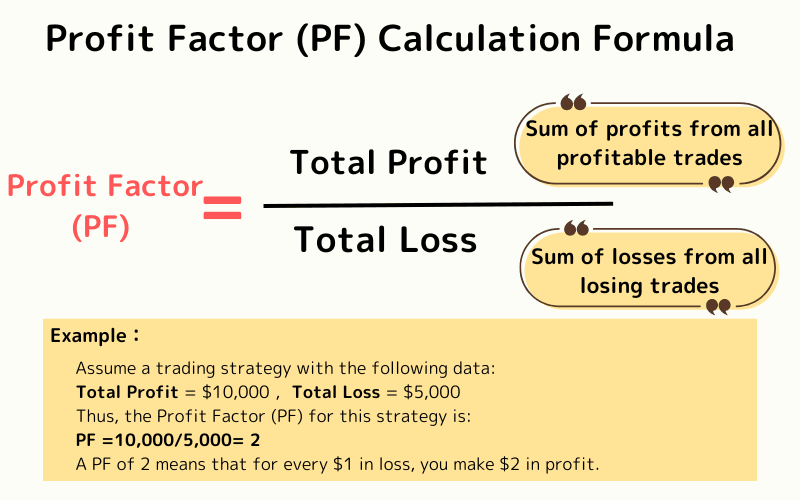
A Profit Factor greater than 1.0 means the strategy is profitable. For example, a Profit Factor of 2.0 means that for every dollar lost, the strategy made two dollars in profit. Conversely, a value below 1.0 indicates a losing strategy. While there's no "magic" number, many traders look for a Profit Factor of 1.5 or higher after accounting for costs, but this can vary widely depending on the strategy's frequency and style.
The following article from Qrypted provides a simple Python implementation that you can adapt for your own trade analysis.
Analyzing Backtest Results and Performance Metrics - Qrypted
This article offers concise Python code for several key performance metrics.
Focus on the subsection titled Profit factor. Note how it first separates winning and losing trades from a pandas DataFrame and then applies the formula. You'll see this pattern of filtering a list of trades frequently in your work.
It's worth noting that the standard Profit Factor can be biased if your position size changes significantly over time (e.g., due to compounding). A large winning trade late in a backtest with a large position size can skew the metric. More advanced approaches, which we may touch on later, involve normalizing each trade's profit or loss to a constant position size to remove this bias. The short video from Darwinex briefly discusses this concept.
9.3) Using 'Return / Max Drawdown' and Normalized Profit Factor Performance Criteria | Backtesting
This video highlights a common bias in the standard Profit Factor calculation and introduces the concept of normalization as a solution.
Watch the first minute, covering the disadvantages of the standard profit factor and the two methods for creating a normalized version. You don't need to implement this now, but it's important to be aware of this potential issue.
Strategy Expectancy: The Average Outcome Per Trade
While Profit Factor gives a great overview, Strategy Expectancy provides a more granular insight: what is the average profit or loss you can expect from each trade? A high win rate is often misleading. A strategy that wins 90% of the time can still lose money if the 10% of losses are massive. Expectancy cuts through this by combining win rate, loss rate, average win size, and average loss size into a single, powerful number.
The common formula for expectancy is:
A positive expectancy means your strategy is profitable on average per trade. A negative value means you're bleeding money with every trade, regardless of your win rate.
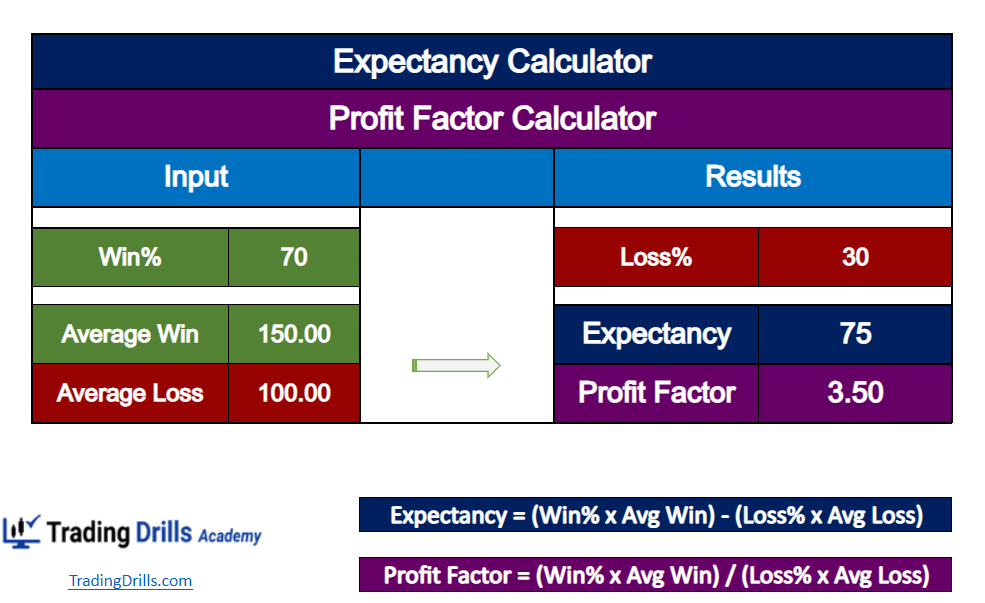
The following guide from TrustyBull provides an excellent conceptual introduction and a step-by-step Python implementation.
How to Calculate Strategy Expectancy in Python — TrustyBull
This article does a great job of explaining why expectancy is a more robust metric than win rate and provides a clear Python walkthrough.
First, read the sections The Big Misconception and Understanding Strategy Expectancy to grasp the core concept. Then, follow the step-by-step guide to see how to implement this in Python, starting from a simple list of trade P&Ls. This is a practical workflow you can use. Finally, review the table in the "How to Improve" section, which brilliantly illustrates the four "levers" you can pull to enhance a strategy's performance.
A Deeper Dive: Expectancy as a Function of Risk (R-Multiples)
The formula we just discussed is widely used and gives you the average P&L per trade. However, for building a robust quantitative system, we can go deeper. Dr. Van Tharp, a renowned trading coach, popularized a more powerful definition of expectancy that normalizes the outcome by the risk taken on each trade.
This approach reframes the question from "How much do I make per trade?" to "How many units of my initial risk do I make per trade?" This is done by calculating the R-Multiple for each trade:
The 'Initial Risk' is the amount of money you stand to lose if your initial stop-loss is hit. For example, if you enter a trade risking $100 and you make a profit of $300, the R-Multiple for that trade is 3R. If you lose $50, your R-Multiple is -0.5R.
The average of all your R-Multiples is your Risk-Normalized Expectancy. A system with an expectancy of 0.5R means you expect to make 50% of your initial risk, on average, per trade. This metric is superior for comparing different strategies because it's independent of position size and dollar amounts.
The video "How To Calculate Expectancy In Trading?" from the StatOasis channel provides the best explanation of this concept.
How To Calculate Expectancy In Trading?
This video explains the critical difference between average trade and true risk-normalized expectancy, a concept central to professional quantitative system design.
First, watch the introduction from the start, where the presenter explains why the common internet formula for expectancy is actually just the "average trade" and lacks a risk dimension. Next, see the correct equation, which normalizes the average trade by the average risk. The most important part is the explanation of R-Multiples. Pay close attention to how each trade's P&L is divided by the initial risk to get an R-Multiple, and how the average of these R-Multiples is the truest form of expectancy. The video then makes another crucial point about trade frequency, showing how a system with lower expectancy but more trades can be more profitable overall. Finally, the segment on what to do when you don't have an explicit initial risk (e.g., using the average loss as a proxy) is a very practical piece of advice.
Conclusion
This lesson completes our initial survey of foundational performance metrics. You've moved from high-level, portfolio-based statistics to the granular, trade-by-trade analysis that is essential for strategy development.
Here are your key takeaways:
- Profit Factor is a simple, effective ratio of gross profits to gross losses. A value above 1.5 is often considered healthy.
- Strategy Expectancy calculates the average expected profit or loss per trade. It provides a more complete picture than win rate alone.
- The most robust form of expectancy involves R-Multiples, which normalize each trade's outcome by its initial risk. This creates a standardized metric that is ideal for comparing different systems and managing position size.
- Trade Frequency matters. A system's total profitability is a function of its expectancy and the number of opportunities it gets to trade.
You have now built a solid foundation in data handling and performance measurement. In our next module, we will put this knowledge to work. We'll begin by building your first vectorized backtester in Python, a powerful tool that allows you to rapidly test strategy ideas against historical data and generate the very metrics you've just learned to calculate.