Hello! Welcome to the sixth lesson in our module on Model Optimization and Deployment.
In the last few lessons, we've focused on the engineering of diffusion models—speeding up inference, increasing throughput, and managing memory. We now have a toolbox to make our models run faster and more efficiently. But this raises a critical question: as we optimize, how do we ensure we're not degrading the quality of the output?
This lesson transitions from how a model runs to how well it performs. We'll tackle the learning outcome: Compare standard evaluation metrics (e.g., FID, IS, CLIP Score) and analyze their respective strengths and weaknesses. Understanding these metrics is essential for any serious practitioner. You'll use them to benchmark different models, track training progress, and make informed decisions about the trade-offs between performance and quality.
We will cover:
- An overview of the main automated metrics used for generative models.
- A deep dive into metrics for image quality and diversity: Fréchet Inception Distance (FID) and Inception Score (IS).
- An analysis of metrics for text-to-image alignment: CLIP Score and CLIP Directional Similarity.
- A critical look at the limitations of these metrics and the modern approach to improving them.
1. The Need for Quantitative Evaluation
The ultimate judge of a generative model's output is human perception. However, conducting large-scale human evaluations is slow, expensive, and can be subjective. Therefore, we rely on quantitative, automated metrics as a proxy for human judgment. These metrics allow us to rapidly compare models and track improvements during development.
A good evaluation framework typically separates two key aspects:
- Fidelity and Diversity: How realistic are the generated images (fidelity)? And do they span the full variety of the real data (diversity)?
- Prompt Alignment: For conditional models like text-to-image, how well does the output match the given conditioning (e.g., the text prompt)?
Let's begin by exploring the most common metrics for fidelity and diversity.
The Hugging Face diffusers documentation provides an excellent practical overview of evaluation. We'll use it as a guide for the implementation details. Start by reading the introduction to get a feel for the landscape.
Read the introductory sections up to, but not including, 'Quantitative Evaluation'. This will frame the discussion on qualitative (human) versus quantitative (automated) evaluation and introduce the benchmarks like PartiPrompts that motivate the need for these metrics.
2. Metrics for Image Quality and Diversity
Fréchet Inception Distance (FID)
FID is arguably the most widely used metric for evaluating the quality of generated images. It aims to measure the similarity between the distribution of real images and the distribution of generated images.
The Core Idea:
- Take a large set of real images and a large set of generated images.
- Use a pre-trained Inception-V3 network to extract feature vectors (activations from an intermediate layer) for every image in both sets.
- Model the distribution of these feature vectors for both the real and generated sets as multivariate Gaussian distributions.
- Calculate the "Fréchet distance" between these two Gaussian distributions. This distance is a measure of how far apart the two distributions are.
The formula for the Fréchet distance between two Gaussians defined by their means () and covariance matrices () is:
A lower FID score indicates that the distribution of generated images is closer to the distribution of real images, which is better.

Strengths:
- Correlates well with human perception: Compared to older metrics, FID has shown a stronger correlation with human judgments of image quality and realism.
- Considers the real dataset: Unlike some metrics, it directly compares the generated samples to a distribution of real samples.
Weaknesses and Criticisms:
- Dependence on Inception-V3: FID relies on features from an Inception-V3 model pre-trained on ImageNet. This creates a significant bias. The metric is most sensitive to features relevant to the 1000 ImageNet classes (e.g., animals, objects). It may be less effective at evaluating datasets with different domains, like medical images, faces, or abstract art.
- Fragility: The score is sensitive to the number of samples used, the image resolution, and even the image compression format (PNG vs. JPEG). This makes it difficult to compare FID scores reported across different papers unless the evaluation setup is identical.
- Combines Fidelity and Diversity: FID provides a single score, making it impossible to distinguish between a model that generates high-fidelity but low-diversity samples (mode collapse) and one that has good diversity but lower fidelity.
Let's look at a practical implementation of FID for a class-conditioned model.
Read the section on 'Class-conditioned image generation'. Pay attention to how real and fake images are prepared and passed to the torchmetrics FID calculation function. Note the discussion on factors that can influence the FID score, such as the number of inference steps and the scheduler.
Inception Score (IS)
Inception Score is an older metric that was popular before FID became the standard. It attempts to measure both the quality and diversity of generated images, but it does so without using any real images for comparison.
The Core Idea:
- Quality: For each generated image, it should be easily classifiable by the Inception-V3 model. This means the predicted probability distribution for a generated image should have low entropy (i.e., the model is confident it belongs to one specific class).
- Diversity: The model should generate a wide variety of images covering many different classes. This means the marginal probability distribution of classes, , should have high entropy (i.e., all classes are equally represented).
IS combines these two ideas using the Kullback-Leibler (KL) divergence: . A higher IS is better.
Weaknesses:
- It's even more heavily biased by the ImageNet dataset than FID. It's completely meaningless for datasets that don't contain ImageNet-like objects.
- It does not compare the generated images to real ones. A model could simply memorize and generate one perfect image for each of the 1000 ImageNet classes to achieve a near-perfect score.
- It is known to be susceptible to adversarial examples and is not a reliable measure of true generative quality.
For these reasons, IS is now largely considered a legacy metric, but it's important to know what it is when reading older literature.
3. Metrics for Text-Image Alignment
For text-to-image models, we need to evaluate not just the quality of the image, but how well it matches the text prompt. This is where CLIP comes in.
CLIP Score
The CLIP (Contrastive Language-Image Pre-Training) model learns a shared embedding space for images and text. The CLIP Score leverages this by measuring the similarity between a generated image and its source prompt in this shared space.
The Core Idea:
- Take a generated image and the text prompt used to create it.
- Use the CLIP image encoder to get a feature vector for the image.
- Use the CLIP text encoder to get a feature vector for the text.
- Calculate the cosine similarity between the two vectors. A higher score means the image and text are closer in CLIP's embedding space.
A higher CLIP score suggests better alignment between the image and the prompt.
Strengths:
- Directly measures alignment: It's a direct, quantitative measure of the semantic correspondence between prompt and image.
- Correlates with human judgment: Generally, images that humans feel match a prompt well also receive a high CLIP score.
Weaknesses:
- Does not measure image quality: An image can be of very poor quality (e.g., blurry, distorted, nonsensical) but still get a high CLIP score if its content is semantically aligned with the prompt.
- CLIP's own biases: The score is only as good as the underlying CLIP model. CLIP has its own biases and blind spots based on its training data.
- "Gaming" the metric: It's possible to generate images that are not aesthetically pleasing but are optimized to produce a high CLIP score (so-called "adversarial examples").
The Hugging Face guide provides a clear, practical example of how to calculate the CLIP score and use it to compare two different model checkpoints.
Read the section 'Text-guided image generation'. Note how the CLIP score is calculated and how it can be used to show that Stable Diffusion v1.5 performs better than v1.4 on a given set of prompts. This demonstrates a key use case for the metric.
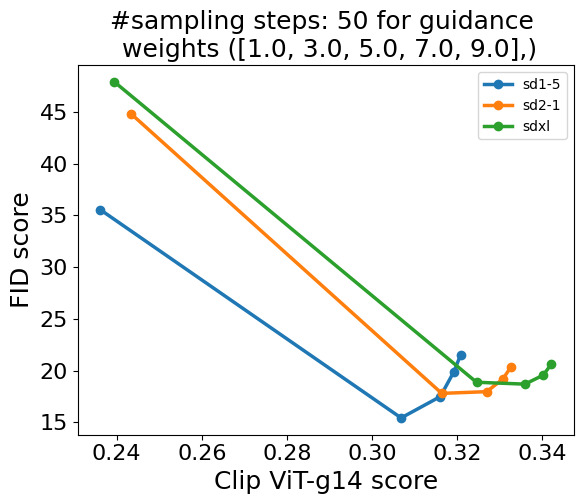
Often, there is a trade-off between image quality (FID) and prompt alignment (CLIP Score). For example, increasing the guidance scale in a diffusion model might improve the CLIP score (the image follows the prompt more closely) but can degrade image quality, leading to a worse FID score.
CLIP Directional Similarity
For image editing tasks (e.g., InstructPix2Pix), a more nuanced metric is needed. CLIP Directional Similarity evaluates if the edit performed on the image corresponds to the instruction given.
The Core Idea:
- You have an original image and an original caption ("a photo of a car").
- You have an edit instruction ("make it red") which implies an edited caption ("a photo of a red car").
- You generate the edited image.
- You then check if the direction of change in the CLIP image embedding space (vector from original image to edited image) is similar to the direction of change in the text embedding space (vector from original caption to edited caption). This is done by computing the cosine similarity of the difference vectors.
This is a clever way to measure if the model correctly interpreted the editing instruction.
Test your understanding!
You are fine-tuning a text-to-image model on a custom dataset of architectural drawings. After training, you notice the FID score (calculated against a real test set) has improved, but the CLIP score on your test prompts has slightly decreased. What is a likely interpretation of this result?
Show answer
This result suggests your fine-tuned model has become better at generating images that match the style and distribution of your architectural drawings dataset (improved FID). However, it may have become slightly worse at following the specific semantic details of the text prompts (decreased CLIP score). This could be a form of "style capture" where the model over-indexes on the visual style of the new dataset at the expense of general prompt-following ability learned from its original training. It highlights the importance of using multiple metrics to get a complete picture.
4. The Modern View: Moving Beyond Inception
The weaknesses of Inception-based metrics like FID have led to significant research into better evaluation methods. A groundbreaking paper, "Exposing flaws of generative model evaluation metrics...", conducted the largest-ever human evaluation study and came to a stunning conclusion.
Exposing flaws of generative model evaluation metrics
To bring your understanding to an expert level, it's crucial to know the latest critiques of standard metrics. This paper, 'Exposing flaws of generative model evaluation metrics...', is essential reading on the topic. We will focus on its main conclusions.
You don't need to read the whole paper, but I encourage you to read the abstracts and summaries of these key sections: Abstract and Section 2 (Introduction): Grasp the core problem: current metrics like FID don't align with human perception, especially for diffusion models. Section 3 (Human evaluation): Understand their methodology. They found that diffusion models consistently produce more realistic images than GANs in human tests, even when FID scores suggest otherwise. Section 4.2 (The (mis)alignment): This is the key part. It shows correlation plots confirming that Inception-V3 based metrics correlate poorly with human evaluation, while metrics using other feature extractors do much better. Section 6 (Conclusions): Read the summary of their main recommendation.
The key takeaways from this research are:
- FID Unfairly Penalizes Diffusion Models: Human evaluators consistently rate the output of top diffusion models as more realistic than that of top GANs. However, the GANs often achieve better (lower) FID scores.
- The Problem is the Encoder, Not the Metric: The issue isn't the Fréchet Distance calculation itself, but the feature extractor used: Inception-V3. Its ImageNet bias fails to capture the perceptual qualities that make diffusion model outputs seem realistic to humans.
- The Solution: Use Better Encoders: The authors show that when you replace Inception-V3 with more powerful, modern self-supervised encoders like DINOv2, the resulting Fréchet Distance metric (let's call it
FD-DINOv2) correlates much more strongly with human judgments of realism.
As a practitioner aiming for expertise, your takeaway should be that while FID is the current de facto standard you must report for comparability, you should be deeply skeptical of it. For your own internal model development and comparison, using a more robust feature backbone like DINOv2 for calculating Fréchet Distance will give you a much more accurate assessment of true visual quality.
Conclusion
You now have a comprehensive understanding of the standard metrics used to evaluate diffusion models, along with their critical strengths and weaknesses.
Key Takeaways:
- FID is the industry standard for measuring image quality and diversity. It compares feature distributions between real and generated images but is biased by its Inception-V3 backbone.
- CLIP Score is essential for text-to-image models, measuring prompt-image alignment. It does not measure image quality directly.
- No Single Metric is Perfect: A holistic evaluation requires a dashboard of metrics. You must understand the inherent trade-offs, such as the tension between FID and CLIP score when tuning guidance.
- The Future is Beyond Inception: The most reliable evaluation of image fidelity comes from using Fréchet Distance with modern, self-supervised encoders like DINOv2, which are better aligned with human perception than the old Inception-V3 standard.
Next Lesson Preview:
Knowing what to measure is the first half of the battle. The second is building a robust system to do it efficiently. In our final lesson of the course, we will put theory into practice. You will implement an automated evaluation pipeline to compute these quality and alignment scores for your generated assets, enabling you to systematically benchmark and improve your diffusion models.