Hello! Welcome back to our exploration of diffusion models.
In our last session, we implemented powerful techniques like negative prompting and prompt re-weighting to gain finer control over the generation process. We saw that we could amplify a word's influence by manipulating its cross-attention scores. This naturally leads to a critical question: what if the model isn't paying attention in the first place? How can we "look inside" the model to see what it's focusing on when it generates an image?
Today, we will answer that question. Our learning outcome is to analyze cross-attention maps to debug prompt-to-image alignment. You'll learn how to transform the abstract concept of "attention" into a visual, interpretable heatmap. This is an essential diagnostic skill for any serious practitioner, allowing you to move from guessing why a prompt isn't working to data-driven debugging.
Part 1: From Attention Scores to Visual Heatmaps
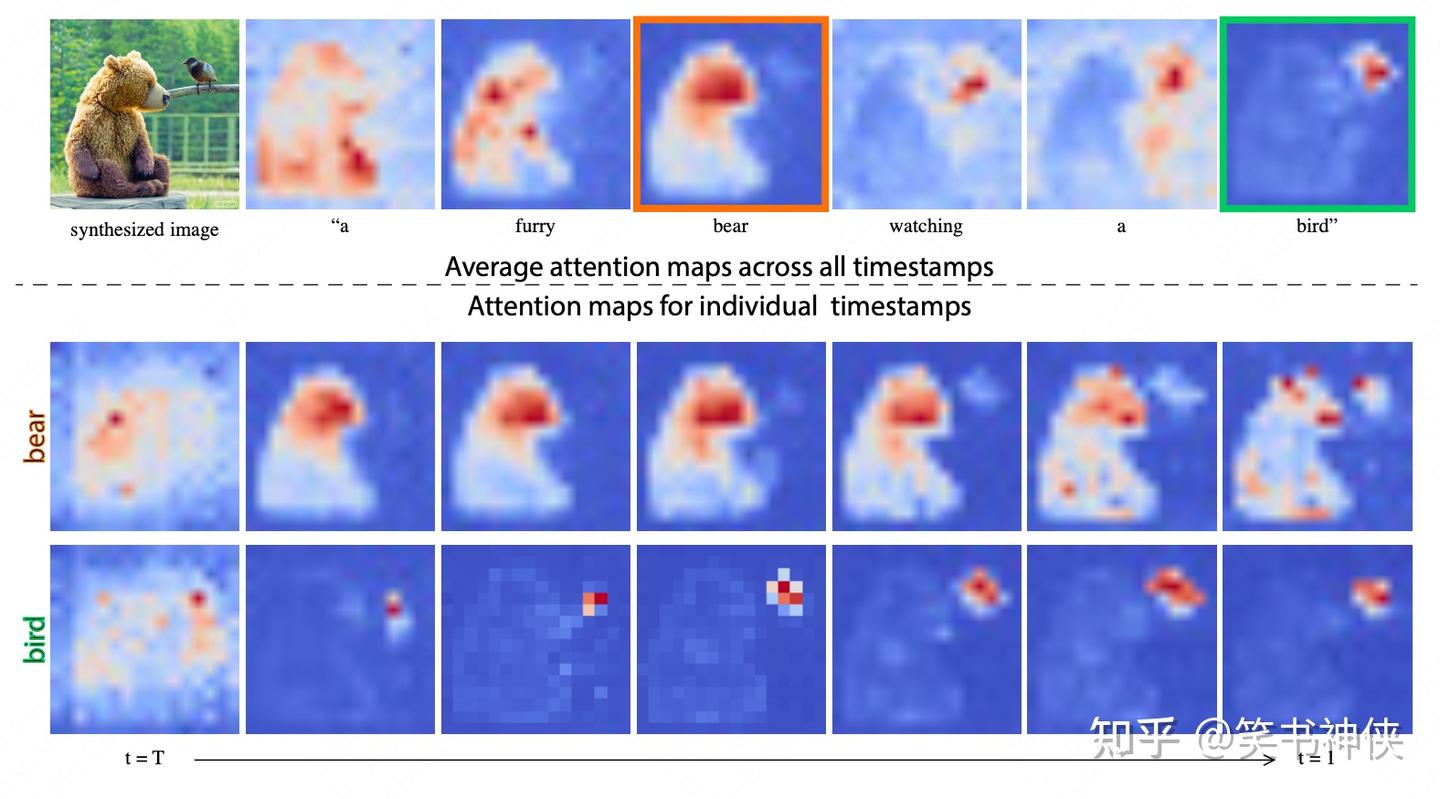
The core idea is simple: for each word (token) in your prompt, the cross-attention mechanism calculates how strongly each pixel (or more accurately, each spatial feature in the U-Net) should attend to that word. If we visualize these attention scores as a heatmap and overlay it on the final image, we can literally see the model's focus.
A high-intensity area on the heatmap for the word "cat" should correspond to the pixels that form the cat in the image. If it doesn't, you've found a prompt alignment failure.
Let's start with a practical demonstration of how this looks in practice.
Understand Stable Diffusion Interpretation using Cross-Attention by DAAM Heatmaps
The YouTube channel '1littlecoder' has a great video demonstrating a tool called DAAM (Diffusion-based Attention-attribution Maps) that generates these heatmaps. This will give you a clear visual intuition for what we're aiming to achieve.
Watch the introduction (00:00-01:11) to understand the problem, then jump to the main demonstration (05:03-09:49) where heatmaps are generated for each token. Notice how the map for 'angry' highlights the face and the map for 'glasses' highlights the eyes. Finally, watch the more complex examples (09:49-13:03) and observe how attention can sometimes be messy or unintuitive, which is exactly what we need to debug.
The "Prompt-to-Prompt" paper, which we've discussed before, provides one of the clearest academic visualizations of this concept.
Part 2: The Theory - What Are We Actually Visualizing?
To effectively use these maps for debugging, we need to be precise about what they represent. As a machine learning engineer, you know that a visualization is only as good as the understanding of the data behind it.
Revisiting the Cross-Attention Mechanism
Recall the cross-attention formula from our previous lessons. The spatial features from the noisy image form the Query (), while the text prompt embeddings form the Key () and Value (). The attention map is computed as:
The element represents the weight given to the -th token's value vector when updating the -th spatial feature of the image. When we generate a heatmap for token , we are visualizing the -th column of this attention matrix, reshaped to match the spatial dimensions of the feature map. You typically average these maps across all attention heads and often across all diffusion timesteps to get a stable, summary view.
For a deeper dive into the mechanics and the original insights, let's revisit the source paper.
Prompt-to-Prompt Image Editing with Cross-Attention Control
The 'Prompt-to-Prompt' paper was the first to popularize this analysis. Reading their description will solidify your understanding of how these maps relate to image structure.
First, review Section 3.1, 'Cross-Attention in Text-Conditioned Diffusion Models', to refresh your memory on the formal definition. Then, read Section 3.2, focusing on the first two paragraphs and Figure 4. This is where the authors state their key observation: 'the spatial layout and geometry of the generated image depend on the cross-attention maps.' Finally, have a quick look at Appendix B.2, which mentions where the cross-attention layers are located in models like Stable Diffusion—this is crucial practical knowledge for implementation.
A Deeper Insight: Maps as Semantic Features
Recent research has shown that these attention maps are more than just weight matrices; they contain rich semantic information inherited from the text encoder and the diffusion U-Net. This is a crucial point for an expert-level understanding. The map isn't just pointing to a location; it carries features of the concept itself.
A CVPR 2024 paper conducted a "probing analysis" to prove this. They trained simple classifiers to predict the word associated with an attention map and found they could do so with high accuracy.
Towards Understanding Cross and Self-Attention in Stable ...
This paper, 'Towards Understanding Cross and Self-Attention in Stable Diffusion', provides a rigorous analysis that will resonate with your ML background. It explains why attention maps are so effective for debugging.
Read Section 3.1 and 3.2 for a clear architectural description of cross- and self-attention in Stable Diffusion. Then, focus on Section 3.4, 'Probing Results on Cross-Attention Maps'. The key takeaway is in Table 1 and the surrounding text: 'the cross-attention map acts as a reliable category representation'. This means the map for 'dog' contains features of a 'dog', not just a pointer to a region.
This finding explains why analyzing these maps is so powerful. When you see a weak map for the word "hat," it's not just that the weights are low; it means the semantic concept of "hat" failed to manifest strongly in the image representation at that U-Net layer.
Part 3: A Debugging Framework Using Attention Maps
Now, let's translate this theory into a practical debugging workflow. When a generated image doesn't match your prompt, visualizing the attention maps is your first and best diagnostic step.
Here are some common failure modes and what you'd expect to see in the attention maps:
1. The Ignored Token
- Symptom: You ask for
a knight holding a red sword, but the sword is grey. The word "red" is ignored. - Attention Map Analysis:
- Hypothesis: The attention map for the token "red" will be weak, diffuse, or completely blank. The map for "sword" might be strong and localized correctly, but the color attribute is missing.
- Action: Generate the heatmaps for "knight", "holding", "red", and "sword". Confirm that the map for "red" is weak.
- Possible Fixes:
- Use prompt re-weighting, as we learned in the last lesson:
a knight holding a (red:1.4) sword. - Change the word order:
a red sword held by a knight. Sometimes this changes the context for the text encoder. - Add the concept to a negative prompt for the opposite: use a negative prompt of
grey sword.
- Use prompt re-weighting, as we learned in the last lesson:
2. Attribute Bleeding / Concept Leakage
- Symptom: You ask for
a photo of a red car next to a blue house. The car has a purple tint, and the sky behind the house looks reddish. The "red" attribute is "bleeding" onto other objects. - Attention Map Analysis:
- Hypothesis: The attention maps for "red" and "car" are not tightly co-located. The "red" map is too diffuse and overlaps with the "house" region.
- Action: Visualize the maps for all key nouns and adjectives. Overlay the "red" map and the "car" map. Do they align well? Now overlay the "red" map and the "house" map. Do they overlap where they shouldn't?
- Possible Fixes: This is a harder problem that indicates the model struggles with composition.
- Simplify the prompt. Generate the red car first, then use image-to-image or inpainting to add the house.
- Rewording to create stronger associations can sometimes help, e.g.,
a car, which is red, is next to a house, which is blue.
3. Misinterpreted Adjective/Style
- Symptom: You ask for
an impressionist painting of a sunflower. The result is a photorealistic sunflower. The style "impressionist" is ignored. - Attention Map Analysis:
- Hypothesis: The attention map for "impressionist" will be weak or may incorrectly highlight a specific object instead of influencing the global style. The map for "sunflower" will be strong.
- Action: Visualize the maps. If the "impressionist" map is weak, the model is not prioritizing the style.
- Possible Fixes:
- Re-weight the style:
(impressionist painting:1.3) of a sunflower. - Place style prompts at the beginning:
impressionist style, a painting of a sunflower.
- Re-weight the style:
Test your understanding!
You are trying to generate an image with the prompt "a small cat sleeping on a large green sofa". The model generates an image of a large cat on a small green sofa. The cat and sofa are the wrong relative sizes.
What would you hypothesize to see in the cross-attention maps for "small", "cat", "large", and "sofa"? How would you use this information to start debugging?
Show answer
-
Hypothesis: You would hypothesize that the model has a weak compositional understanding and is struggling to bind the adjectives "small" and "large" to the correct nouns.
- The attention map for "cat" would likely be strong and correctly located on the cat.
- The attention map for "sofa" would also be strong and located on the sofa.
- The attention map for "small" would likely overlap more strongly with the sofa region than the cat region.
- The attention map for "large" would likely overlap more strongly with the cat region than the sofa region.
In essence, you'd see a "cross-wiring" of adjectives to the wrong nouns in the attention space.
-
Debugging Steps:
- Verification: First, generate and visualize the heatmaps for all four tokens ("small", "cat", "large", "sofa") to confirm this hypothesis.
- Intervention: Since this is a classic compositional failure, you could try:
- Rewording: Try to create tighter bindings, e.g.,
(a small cat) is sleeping on (a large green sofa). Using parentheses (supported in some UIs) can sometimes encourage the tokenizer to group concepts. - Negative Prompting: Add
large cat, small sofato the negative prompt to explicitly steer the model away from the failure case. - Iterative Generation: Generate
a large green sofafirst. Then use that image as an input to an image-to-image model with the promptadd a small cat sleeping on the sofa, possibly with a mask.
- Rewording: Try to create tighter bindings, e.g.,
Conclusion
You have now added a powerful diagnostic tool to your engineering toolkit. By visualizing cross-attention, you can build a much clearer mental model of the diffusion process, identify the root cause of prompt alignment failures, and make more informed decisions about how to fix them.
Key Takeaways:
- Cross-attention maps are visualizations that show the strength of the relationship between prompt tokens and image regions.
- They are generated by plotting the columns of the attention matrix () from the U-Net's cross-attention layers.
- These maps are not just weight matrices; they are rich semantic representations of the concepts they correspond to.
- Analyzing these maps allows you to debug common failures like ignored tokens and attribute bleeding by seeing precisely where the model's understanding breaks down.
Next Lesson Preview:
We have spent the last few lessons deep in the U-Net's attention mechanism—conditioning it, controlling it, and now, analyzing it. These complex operations are computationally expensive. In the next lesson, we will switch gears to a critical engineering topic: applying gradient checkpointing to reduce memory usage during training. This is a fundamental technique for making the training of large models like these feasible on available hardware by trading compute time for a significantly smaller memory footprint.