Introduction
Welcome to the start of your deep dive into performance marketing. This first lesson lays the essential groundwork for everything that follows. Our goal is to master the language of performance marketing: the key performance indicators (KPIs) that measure the success or failure of a campaign. You mentioned that you have hands-on experience with ad platforms but want to build your knowledge from the ground up to a professional level. This lesson is designed to do exactly that. We will solidify your understanding of core metrics by not just defining them, but by learning how to calculate them from raw campaign data—a fundamental skill for any serious performance marketer.
By the end of this lesson, you will be able to calculate CPC, CPM, CPA, ROAS, CTR, and CVR, and understand what each of these metrics tells you about your campaign's performance.
The Building Blocks of Performance Marketing
In performance marketing, every action and its associated cost can be measured. This allows us to move beyond guesswork and make data-driven decisions. While you might see these metrics in your Google Ads or Meta Ads dashboard, understanding their underlying formulas is crucial for true analysis and strategy.
The entire system starts with two fundamental events:
- Impression: Your ad is displayed on a screen.
- Click: A user interacts with your ad by clicking on it.
From these, and a few other data points like cost and conversions, we can derive all the essential performance metrics.
Let's begin by formally defining the core KPIs. The following article provides clear, concise definitions and formulas for the metrics that are central to this lesson.
Programmatic advertising metrics: Everything you need to ...
This article from Eskimi provides an excellent glossary of advertising metrics. We'll use it to establish a solid foundation for the terms we'll be using throughout the course.
Please read the definitions for the following key metrics. Focus on understanding both the "Use case" and the formula provided for each. Impressions Clicks Click-through rate (CTR) Conversion rate (CVR) Cost per mille (CPM) Cost per click (CPC) Cost per acquisition (CPA) Return on ad spend (ROAS)
These formulas are the bedrock of performance analysis. The image below presents some of these key calculations in a clear, visual format. ROAS and CPA (often referred to as Customer Acquisition Cost or CAC in a broader business context) are particularly important as they directly measure the financial viability of your campaigns.

This infographic displays the formulas for several key investment-focused KPIs, including Cost Per Lead, Customer Acquisition Cost, Customer Lifetime Value, and Return On Ad Spend.
From Theory to Practice: A Step-by-Step Calculation
Now that we have the definitions, let's see how these metrics are calculated in a practical scenario. The following video walks through a simple campaign example, starting with a budget and a goal, and then calculating each KPI along the way. This will help connect the formulas to a real-world marketing flow.
Marketing Analytics 101 (A Beginner’s Guide To Marketing Metrics)
In "Marketing Analytics 101," Adam Erhart demonstrates how to track a campaign from initial budget to final ROI. This walkthrough perfectly illustrates how the metrics we've just defined are interconnected.
Watch the video from the beginning until the end of the example. As you watch, pay close attention to how each calculation builds on the last: Setting the Stage (budget and goal): Note the initial budget and sales goal. Calculating Impressions & CPM (cost per mil): See how the budget and CPM determine the total number of impressions. Calculating Clicks, CPC & CTR (clicks): Observe how clicks are used to derive both Cost Per Click and Click-Through Rate. Calculating Conversions, CPA & CVR (actions): Watch how the number of sales is used to find the Cost Per Acquisition and Conversion Rate. Calculating Profit & ROI (profitability): Finally, see how revenue and ad spend are used to calculate the ultimate profitability and Return on Investment.
Hands-On: Calculating KPIs from Raw Data
This is where your practical skills come into play. A core task for any performance marketer is to take a raw data export from an ad platform, import it into a spreadsheet, and perform their own analysis. The following resource demonstrates exactly this process. While the example uses an hourly report from Amazon Ads for a technique called "dayparting," the methodology for calculating KPIs is universal and directly applies to analyzing reports from Google Ads, Meta Ads, or any other platform.
How to Use Dayparting for Amazon Ads | Chris Rawlings posted on the topic | LinkedIn
This screen recording from Chris Rawlings' LinkedIn profile provides a real-world demonstration of how to turn raw campaign data into actionable insights using Google Sheets. We will focus on the data manipulation and calculation part.
Follow along with the video to see how to calculate KPIs from a raw data set. You don't need to download any data yourself; just focus on understanding the process. Setting up the Data: Watch from the pivot table creation to see how the raw data (Impressions, Clicks, Spend, Orders, Sales) is organized in a pivot table. This is the raw material for our calculations. Calculating the Metrics: Now, watch carefully from the formulas section. The presenter calculates several key metrics using simple spreadsheet formulas. This is the heart of the exercise. Notice the formulas used: ACoS (Advertising Cost of Sale): Spend / Sales. This is the inverse of ROAS. So, ROAS = 1 / ACoS. For example, a 25% ACoS is equivalent to a 4.0 ROAS (400%). Click-Through Rate (CTR): Clicks / Impressions Conversion Rate (CVR): Orders / Clicks Cost Per Click (CPC): Spend / Clicks To complete our list, how would you calculate Cost Per Acquisition (CPA) using the data available in the video? The formula would be Spend / Orders. The presenter uses "7 day total orders" as the conversion metric, so CPA would be the total ad spend divided by that number. This hands-on process of transforming rows of raw data into neatly calculated KPIs is what enables the creation of summary dashboards like the one below. Each number on a dashboard represents a calculation derived from more granular source data. A sample performance marketing dashboard showing high-level KPIs like Revenue, ROI, and CAC, alongside charts for trends, channel performance, and a conversion funnel. A Pro-Level Nuance: Understanding Click Quality As you gain experience, you'll learn that not all metrics are created equal. For instance, on platforms like Meta, a "click" can mean many things: a click to your website, a click on your profile picture, a like, or a comment. For a performance marketer focused on driving traffic and sales, only one of those clicks really matters. This is where a more precise metric comes in. The following video explains the difference between a generic click and a more valuable outbound click.
To complete our list, how would you calculate Cost Per Acquisition (CPA) using the data available in the video?
The formula would be Spend / Orders. The presenter uses "7 day total orders" as the conversion metric, so CPA would be the total ad spend divided by that number.
This hands-on process of transforming rows of raw data into neatly calculated KPIs is what enables the creation of summary dashboards like the one below. Each number on a dashboard represents a calculation derived from more granular source data.
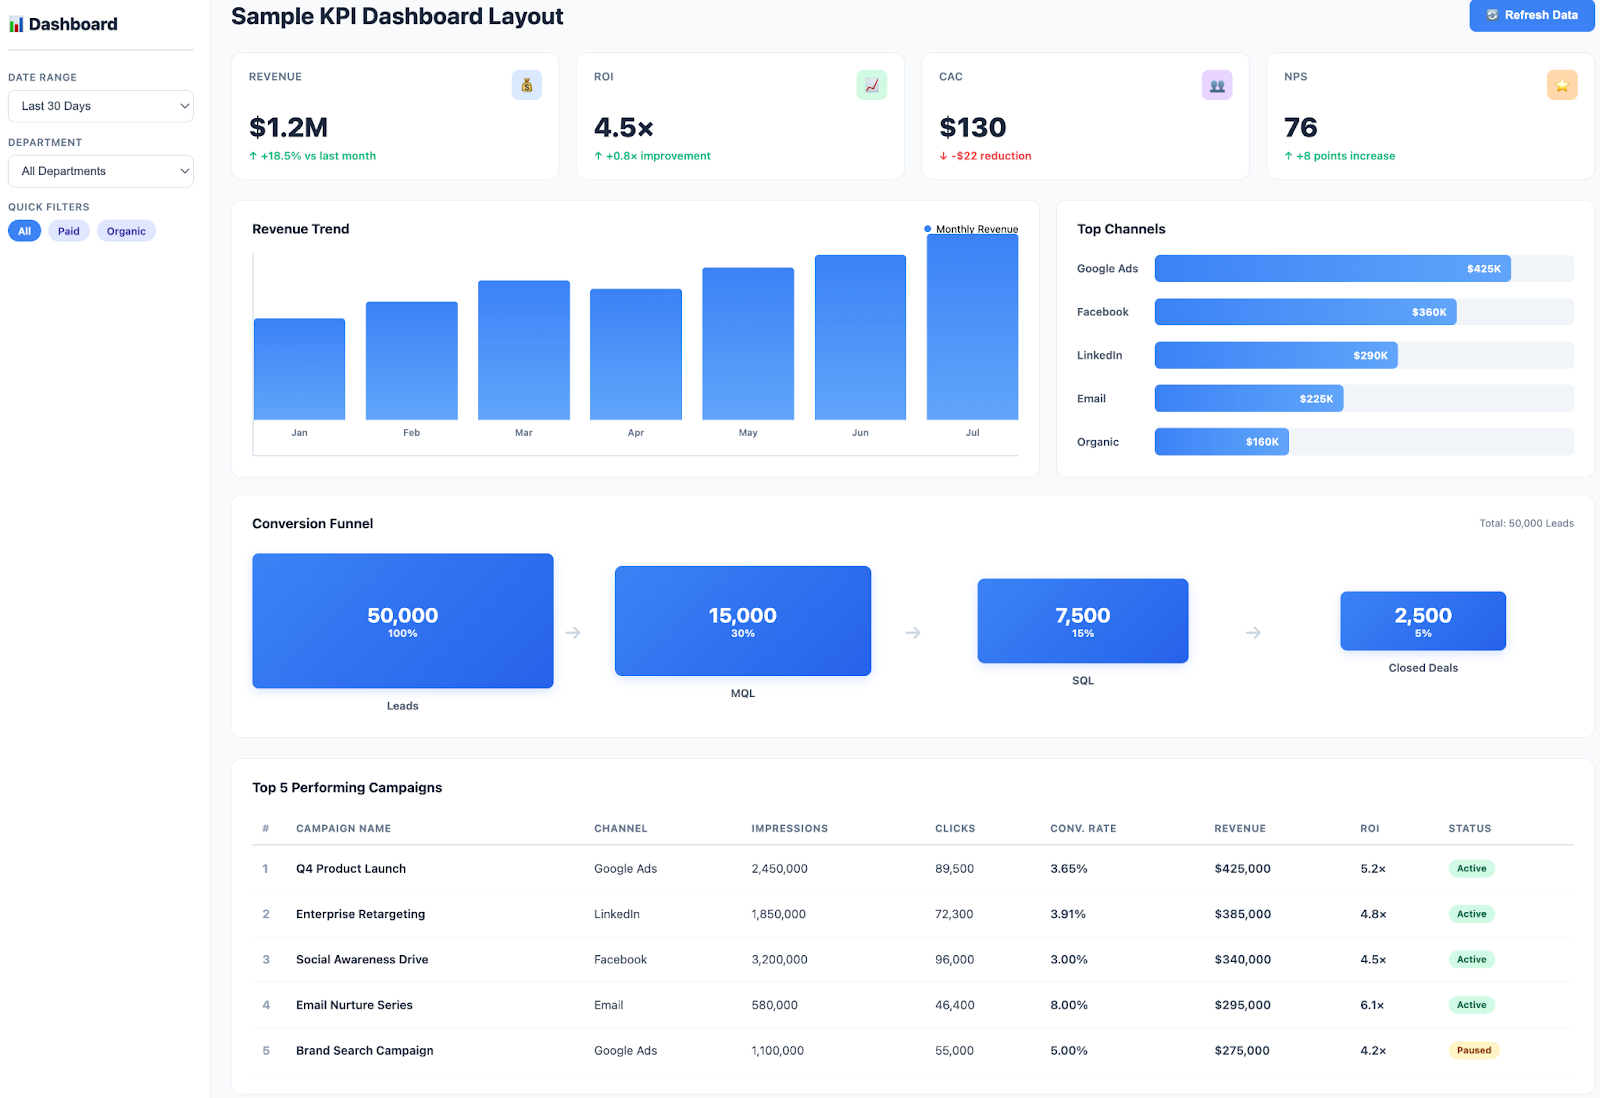
A sample performance marketing dashboard showing high-level KPIs like Revenue, ROI, and CAC, alongside charts for trends, channel performance, and a conversion funnel.
A Pro-Level Nuance: Understanding Click Quality
As you gain experience, you'll learn that not all metrics are created equal. For instance, on platforms like Meta, a "click" can mean many things: a click to your website, a click on your profile picture, a like, or a comment. For a performance marketer focused on driving traffic and sales, only one of those clicks really matters.
This is where a more precise metric comes in. The following video explains the difference between a generic click and a more valuable outbound click.
Every Important Meta Ad Metric Explained (2025)
In this video, media buyer Michael Diaz breaks down the metrics he uses to manage Meta ad accounts. His explanation of click types is a great example of the kind of nuanced understanding that separates beginners from experts.
Watch the segment from Cost per unique outbound click. Pay attention to why the presenter prefers "Unique Outbound Click-Through Rate" over the standard CTR. This metric filters out irrelevant engagement clicks and repeat clicks from the same user, giving a much purer signal of your ad's ability to drive traffic to your landing page.
This distinction is important. When you analyze your own campaigns, using Outbound CTR or Link Click CTR (the name varies by platform) will give you a more accurate measure of creative performance than the generic CTR.
Conclusion
In this foundational lesson, we have defined, contextualized, and calculated the core metrics that drive performance marketing. You learned not just what CPC, CPM, CPA, ROAS, CTR, and CVR mean, but how they are derived from fundamental data points like spend, impressions, clicks, and conversions. We moved from simple definitions to a practical, hands-on spreadsheet exercise, bridging the gap between the numbers you see on a dashboard and the raw data they come from.
Key Takeaways:
- Core Metrics: Performance marketing is built on a handful of key metrics: CPM, CPC, CPA measure cost-efficiency; CTR and CVR measure engagement and conversion effectiveness; and ROAS measures overall profitability.
- Formulas are Key: Knowing the formulas (
CTR = Clicks / Impressions,CPA = Spend / Conversions, etc.) allows you to perform your own analysis and deeply understand your campaign dynamics. - Data Flow: Performance analysis follows a logical flow: Impressions → Clicks → Conversions. Metrics at each stage tell you a different part of the story.
- Metric Nuance Matters: For precise analysis, it's important to use the right version of a metric, such as
Outbound CTRinstead of all-encompassingCTR, to measure true intent.
In our next lesson, we will build directly on this foundation. Now that you understand what to measure, we'll explore why and when to focus on certain metrics by mapping campaign objectives to the different stages of the marketing funnel.