Welcome back! In our previous lesson, we delved into the logical heart of LLVM IR, learning how br and phi instructions create control flow for everything from simple conditionals to complex loops. You now understand how the program's execution path is defined. However, the raw instructions and values only tell part of the story. They describe what the program does, but not why or how it relates back to the original source code.
This lesson addresses that gap by focusing on metadata. Our goal is to explain the role and syntax of metadata in LLVM IR, focusing on debug information. We will explore why LLVM needed a dedicated system for this "extra" information, how that system is structured, and how it's used to build a bridge from low-level IR back to the C++ code you write. This is a critical piece of the puzzle for debugging the compiler itself and for understanding how a debugger like GDB or LLDB can map optimized machine code back to your source lines.
The Problem: Information That Isn't Code
When a compiler processes your code, it has a wealth of information that isn't strictly necessary for the program to run: variable names, source file paths, line numbers, and type information. While this is stripped from the final executable by default, it's essential for debugging. How should this information be represented inside the compiler?
Early versions of LLVM used a clever but problematic trick: encoding this data in specially-named global variables. This approach had significant drawbacks, which are important to understand as they motivate the modern metadata system.
Extensible Metadata in LLVM IR - The LLVM Project Blog
This blog post from the LLVM Project blog provides excellent context on the evolution of metadata. It begins by describing the old method and its flaws, which perfectly sets the stage for the current solution.
First, read the section Debug Information in LLVM 2.6. Pay close attention to the example using section "llvm.metadata" and the two major drawbacks discussed: interfering with optimizations and creating unnecessary clutter. Next, read the following section, Motivation for LLVM IR Metadata, which outlines the design goals for a new, first-class metadata system.
As you've just read, the core motivation was to create a system that could carry this auxiliary information without affecting optimizations or cluttering the IR. This led to a fundamental design principle you must always remember when working with LLVM:
Metadata is "value-add" information that must not change the semantics of the program. Optimizers are generally free to ignore or discard it.
This means you can't use metadata to pass critical information that the program's logic depends on. If you do, an optimization pass might drop it, and your program's behavior will silently change. Its primary purpose is for things like debug info, where losing it only degrades the debugging experience but doesn't break the program itself.
The Syntax of Metadata
With the "why" established, let's look at the "how." LLVM introduced a set of new constructs to represent metadata cleanly. These are the building blocks you'll see throughout the IR.
Extensible Metadata in LLVM IR - The LLVM Project Blog
This section of the same blog post provides a concise and clear breakdown of the different syntactic elements of the metadata system.
Please read the entire section Metadata in LLVM 2.7. As you read, focus on identifying these four key components: metadata type: A special type that restricts where metadata can be used. MDString: A string literal, written as !"some string". MDNode: A numbered tuple of other values, including constants, IR values, or other metadata. This is the most common construct. It's written as !123 = !{...}. NamedMDNode: A module-level named entry point that groups related MDNodes, like !llvm.dbg.cu = !{!0, !1}. Instruction Attachments: How metadata is attached to an instruction, using a tag like !dbg. For example: ret void, !dbg !9.
These components work together to form a structured, interconnected web of information that sits alongside the executable IR code. A NamedMDNode (e.g., !llvm.dbg.cu for "compile unit") acts as a root, pointing to MDNodes that describe files, functions, and types, which in turn point to other nodes or are attached directly to instructions.
Focus: Representing Debug Information
Now, let's connect this abstract syntax to its most prominent application: source-level debug information. The entire system of metadata nodes is used to recreate the structure of your source program in a way that is inspired by the DWARF debugging standard.
When you compile with -g, the frontend (Clang) emits special metadata that maps IR objects back to the source language. The two most important markers you'll encounter are #dbg_declare and #dbg_value.
Source Level Debugging with LLVM — LLVM 19.1.0 documentation
This is the official LLVM documentation on debugging information. We will now look at the specific constructs used to track source variables.
First, read the introductory paragraphs of the section Debugging information format. This introduces the concept of "debug records". Then, read the subsections for #dbg_declare, #dbg_value, and #dbg_assign. Pay close attention to the distinction: #dbg_declare describes the address of a variable (e.g., its memory location on the stack). #dbg_value describes the value of a variable at a certain point (e.g., when it's been optimized into a register).
Let's look at a concrete example. The image below shows a simple C function on the left and its corresponding LLVM IR (generated by clang -emit-llvm) on the right.
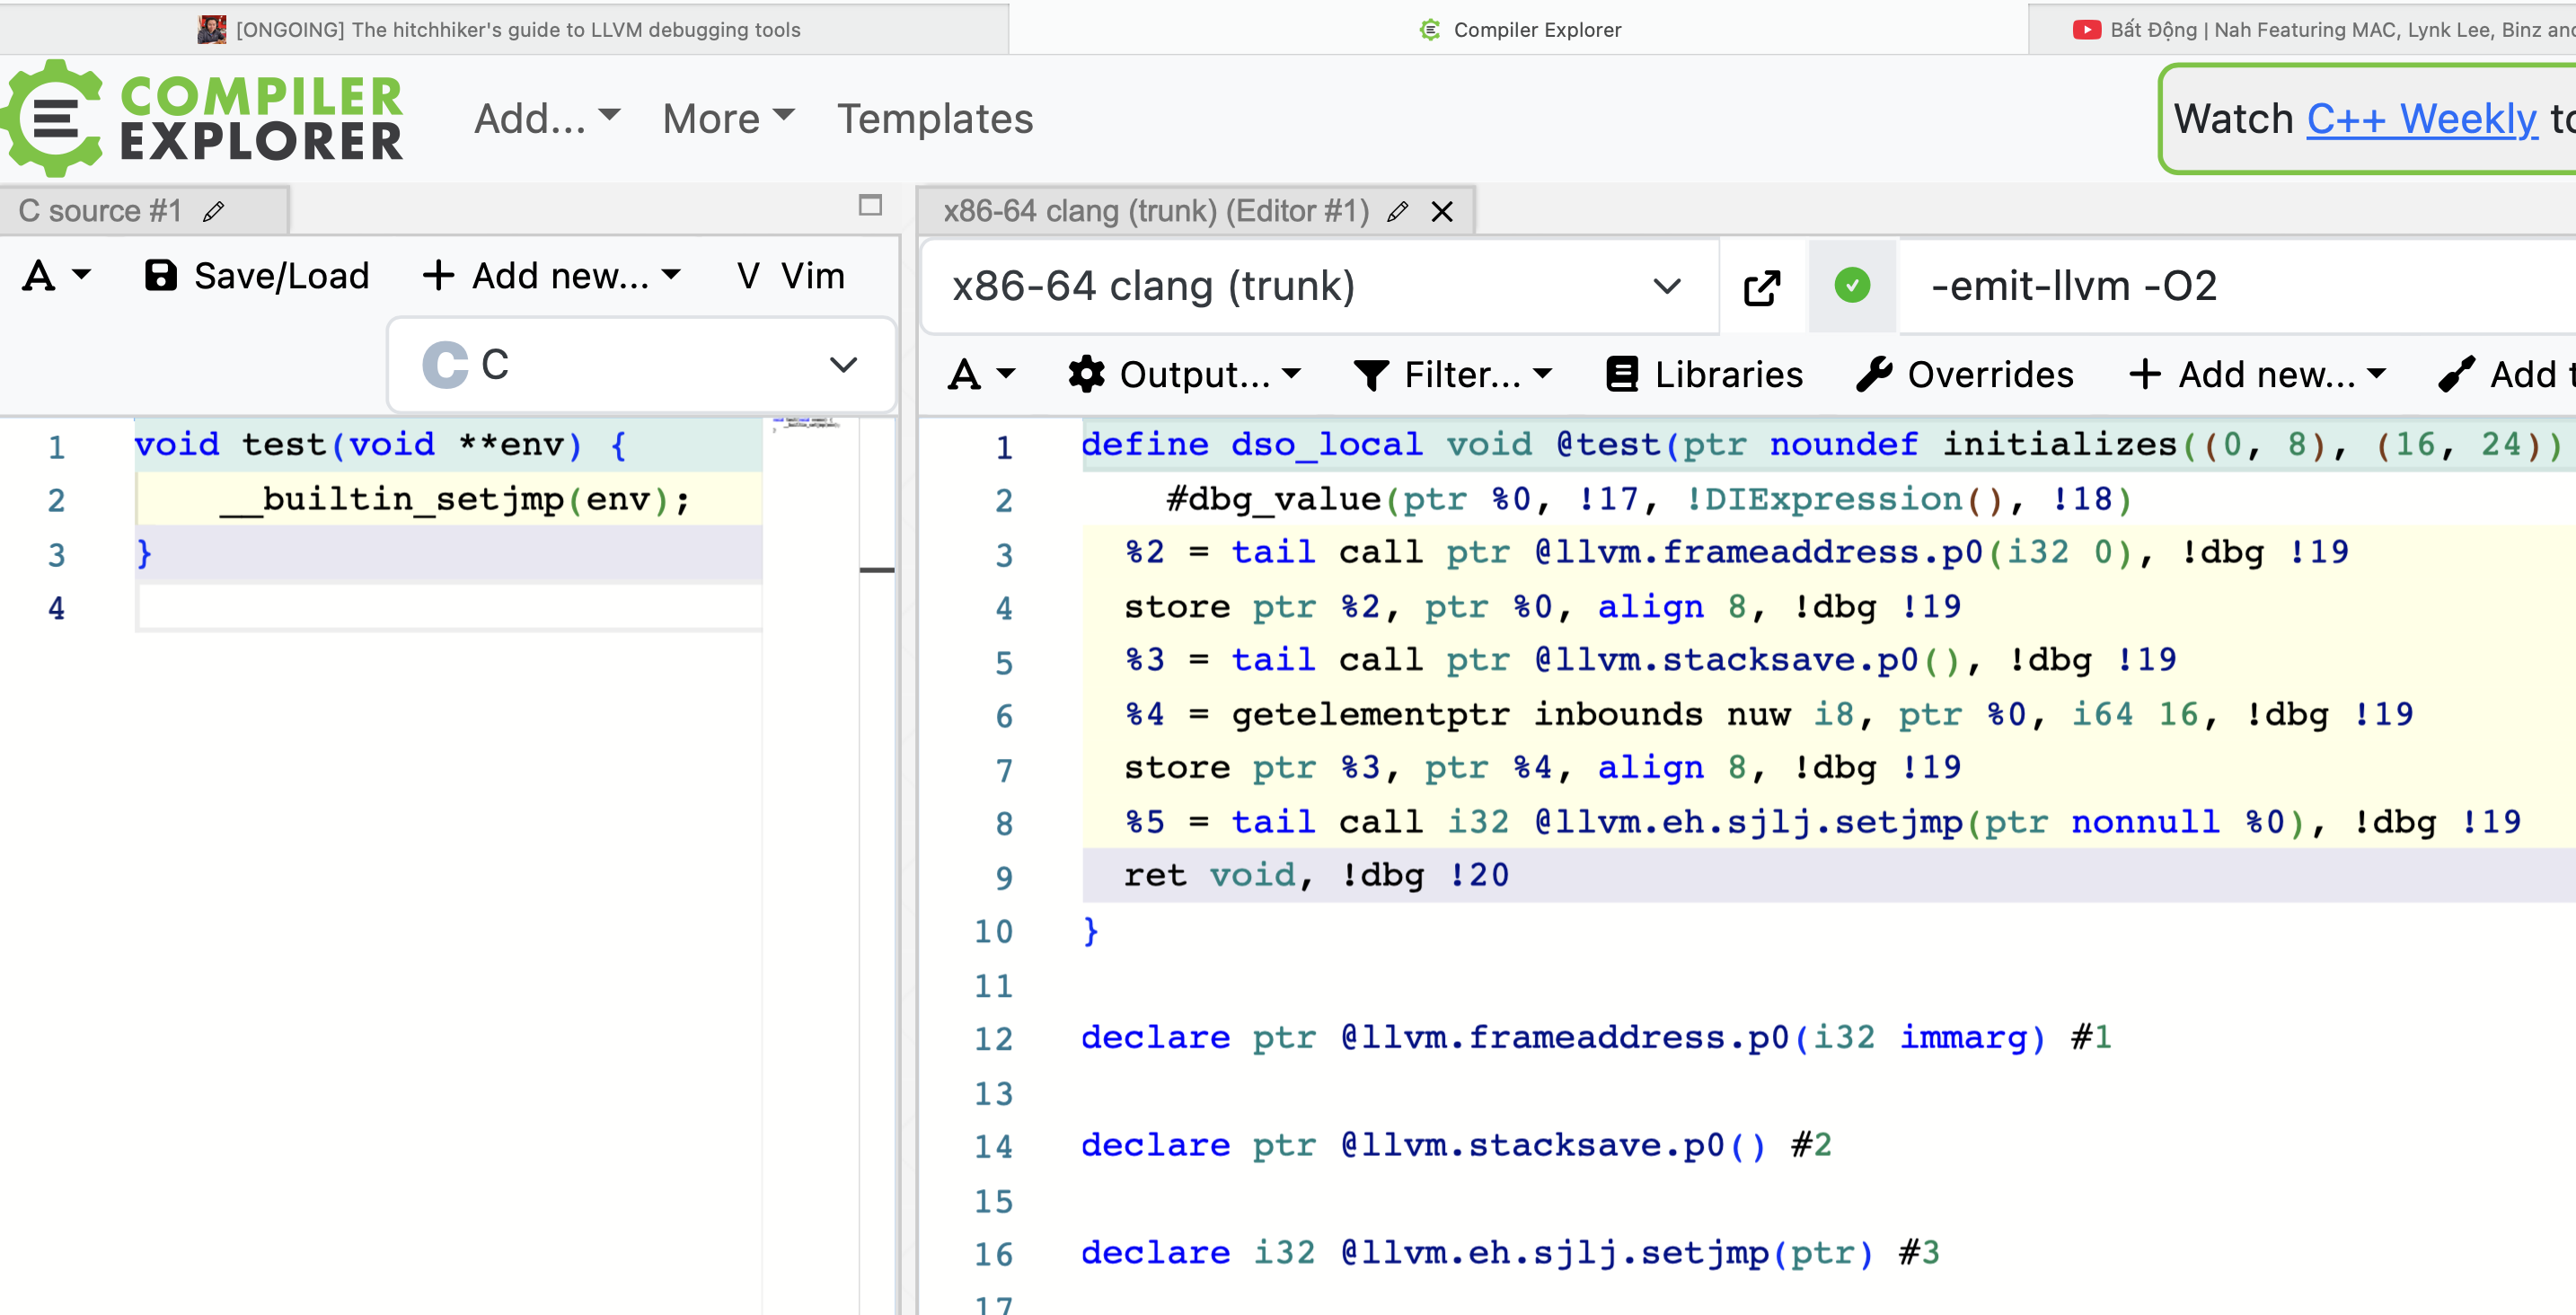
In the image, you can see !dbg attachments on several instructions, each pointing to a metadata node that contains file and line number information. You also see a #dbg_value record. This demonstrates exactly how Clang uses the metadata system to annotate the IR it produces, providing the hooks a debugger needs.
A Complete Example: Scopes and Locations
The true power of this system comes from how different metadata nodes are linked to describe the full context of the source code. A single !dbg attachment on an instruction points to a DILocation node. This node contains the line and column number, but more importantly, it also references a scope—which could be a DILexicalBlock (for a {...} block) or a DISubprogram (for a function). This creates a hierarchy that mirrors your source file's structure.
Let's walk through the canonical example from the LLVM documentation.
Source Level Debugging with LLVM — LLVM 19.1.0 documentation
This section provides a complete, annotated example of a C function with nested scopes and its corresponding LLVM IR, showing exactly how the metadata nodes link together.
Read the section Object lifetimes and scoping. Trace the metadata nodes for the variable Z. You will see: The #dbg_declare instruction for Z points to a location !19. !19 is a DILocation node that specifies line 5, column 11. Crucially, the scope field of !19 points to !18. !18 is a DILexicalBlock node, representing the inner {...} scope from line 4. This DILexicalBlock node, in turn, points to the DISubprogram node !4, representing the foo function.
This chain of metadata references—from instruction to location to lexical scope to function—is how LLVM encodes the rich structural information of the source language. As a future LLVM contributor, you will often work with the C++ representations of these nodes, which have corresponding class names like DILocation, DILexicalBlock, and DILocalVariable.
Interaction with Optimizations
Finally, let's revisit the interaction with optimizations, which is especially relevant given your interest in performance systems. Compiling with -O0 -g yields straightforward debug info because variables map directly to memory locations on the stack. The debugger can easily read and write these locations.
However, compiling with -O3 -g presents a challenge. The optimizer will aggressively move values from the stack into registers, inline functions, and reorder code.
Source Level Debugging with LLVM — LLVM 19.1.0 documentation
This section of the documentation explicitly discusses the guarantees and trade-offs of debugging optimized code.
Read the section Debug information and optimizations. Focus on the distinction between what is guaranteed (you can always read the state of the program) and what might be lost (the ability to modify variables or call functions that were optimized away).
When an optimizer promotes a variable from a stack alloca into an SSA register, it is responsible for replacing the single #dbg_declare with multiple #dbg_value records to track the variable's value as it flows through the program. This allows a debugger to report the correct value of a variable even if it never exists in memory. However, since there is no memory address, the debugger might not let you modify its value. This is a fundamental trade-off between performance and debuggability.
Conclusion
In this lesson, we have demystified the metadata system that accompanies LLVM IR. You now understand its purpose, syntax, and primary application in providing rich debug information. This knowledge is not just academic; it is essential for diagnosing bugs where the compiler generates incorrect debug information or for understanding how an optimization pass interacts with the source-level view of a program.
Key Takeaways:
- Role: Metadata provides "extra" information that doesn't affect program semantics, with its primary use being source-level debug information.
- Principle: Optimizers are allowed to drop metadata, so it can't be used for anything essential to program correctness.
- Syntax: The system is built from
MDString,MDNode, andNamedMDNodeconstructs, which are attached to instructions via tags like!dbg. - Debug Info: Constructs like
#dbg_declareand#dbg_valueare used to track the location and value of source variables. - Structure: A hierarchy of
DILocation,DILexicalBlock, andDISubprogramnodes are linked together to represent the original source code's structure. - Optimization Trade-off: Debugging optimized code (
-O3 -g) provides an accurate view of program state but may limit the ability to modify it, unlike with unoptimized code (-O0 -g).
In our next lesson, we will explore intrinsic functions. We've already had a glimpse of them with the older llvm.dbg.declare syntax. We will now take a broader look at how LLVM uses these special, built-in functions to expose target-specific features or implement high-level operations that don't have a dedicated single instruction.