Hello! Welcome back.
In our last lesson, we defined deadlock and identified the four necessary conditions for its occurrence: Mutual Exclusion, Hold and Wait, No Preemption, and Circular Wait. You'll recall that Circular Wait involves a chain of processes, each waiting for a resource held by the next.
Today, we will learn how to formally and visually represent these relationships. Our learning outcome is to model resource allocation states using Resource Allocation Graphs (RAGs). This graphical notation is a powerful tool for visualizing the state of a system's resources and processes. Mastering it is the first step toward systematically detecting deadlocks, a common topic in the GATE exam.
1. What is a Resource Allocation Graph?
A Resource Allocation Graph (RAG) is a directed graph that provides a snapshot of the system's state. It clearly depicts which processes are holding which resources and which processes are requesting resources held by others.
A RAG has two types of vertices and two types of edges:
-
Vertices:
- Process Vertices: Represent processes. These are drawn as circles (e.g., ).
- Resource Vertices: Represent resource types. These are drawn as rectangles (e.g., ). A resource type can have one or more identical instances, which are shown as dots inside the rectangle.
-
Edges:
- Request Edge: A directed edge from a process to a resource (). This signifies that process is requesting an instance of resource type and is currently waiting.
- Assignment Edge: A directed edge from a resource to a process (). This signifies that an instance of resource type has been allocated to process .
To see these definitions in action, let's watch a segment of the following video.
L-4.2: Resource Allocation Graph in Deadlock | Single Instance with example | Operating System
This video from Gate Smashers clearly introduces the components of a Resource Allocation Graph. It's a great starting point for understanding the notation.
Watch the first 3 minutes and 14 seconds of the video (00:00 to 03:14). Pay close attention to how processes, resources (both single and multiple instance), request edges, and assignment edges are represented.
For a quick textual reference, the article below from GateVidyalay also provides a concise summary of these components.
Resource Allocation Graph | Operating System
This article, 'Resource Allocation Graph | Operating System', clearly lays out the components of a RAG with helpful diagrams.
Read the sections 'Components Of RAG', 'Vertices', and 'Edges'. This will reinforce the definitions you just saw in the video.
2. Interpreting a Resource Allocation Graph
Now that you know the components, let's practice reading a RAG. The graph below models a specific system state.
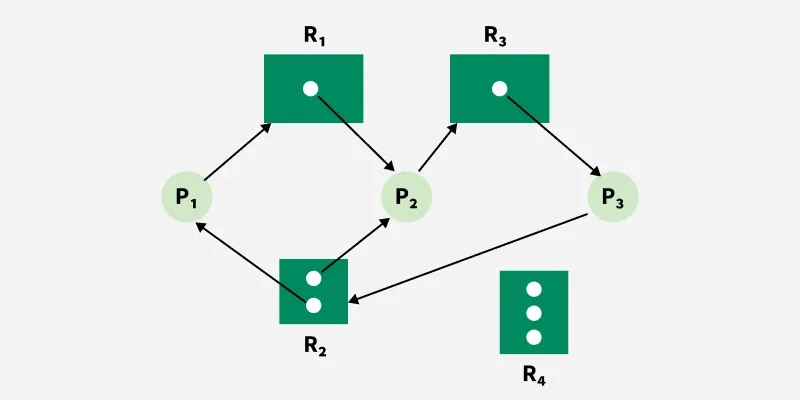
Let's break down the information this graph provides:
- Processes: There are three processes in the system: .
- Resources: There are four types of resources:
- has one instance.
- has two instances.
- has one instance.
- has three instances.
- System State:
- An instance of is allocated to .
- An instance of is allocated to .
- An instance of is allocated to .
- An instance of is allocated to .
- Process is requesting an instance of .
- Process is requesting an instance of .
- Process is requesting an instance of .
Notice the cycle: . This is a visual representation of the circular wait condition we discussed in the last lesson.
Test your understanding!
Consider a system with two processes, and , and two single-instance resource types, and . The system is in the following state:
- holds and is requesting .
- holds and is requesting .
Try to sketch the Resource Allocation Graph for this state. What do you observe?
Show answer
Your sketch should show:
- Two process circles: and .
- Two resource rectangles: and , each with one dot.
- An assignment edge from to .
- A request edge from to .
- An assignment edge from to .
- A request edge from to .
You should observe a cycle: . This is the classic two-process deadlock scenario.
3. RAGs and Deadlock Detection: The Connection
The primary purpose of modeling a system with a RAG is to analyze it for deadlocks. The key indicator is the presence of a cycle. However, the implication of a cycle depends on the number of instances per resource type. This is a critical distinction for the GATE exam.
Rule 1: Single-Instance Resources
If all resources in the system have only a single instance, then:
- A cycle in the RAG is a necessary and sufficient condition for a deadlock.
- If the graph has a cycle, a deadlock exists.
- If the graph has no cycle, there is no deadlock.
Rule 2: Multi-Instance Resources
If there are resource types with multiple instances, then:
- A cycle is a necessary but not sufficient condition for a deadlock.
- If the graph has no cycle, there is no deadlock.
- If the graph has a cycle, a deadlock may or may not exist. You need a more sophisticated algorithm (like the Banker's algorithm, which we'll cover later) to be sure.
The following video discusses these rules and demonstrates deadlock detection in a single-instance RAG.
L-4.2: Resource Allocation Graph in Deadlock | Single Instance with example | Operating System
Let's return to the Gate Smashers video. This part explains the crucial link between cycles and deadlocks, particularly for single-instance resources, which is the focus of our next lesson.
Watch from 03:14 to 08:45 and then the summary from 22:46 to 26:06. Focus on how a cycle directly implies deadlock in the single-instance example and understand the final summary rules presented.
This second video, which you do not need to watch now, demonstrates why a cycle in a multi-instance RAG does not guarantee a deadlock. It shows a system with a cycle that resolves itself because a free process can complete and release its resources, breaking the chain for others. You can bookmark the video titled "L-4.3: Multi-Instance Resource Allocation Graph with Example" (ID: LINK) for future reference when we tackle multi-instance systems.
Conclusion
In this lesson, you learned how to translate a system's process and resource status into a formal model—the Resource Allocation Graph. This graphical representation is fundamental to understanding and analyzing deadlocks.
Key Takeaways:
- RAG Components: A RAG consists of process vertices (circles), resource vertices (rectangles with dots for instances), request edges (), and assignment edges ().
- Modeling: A RAG provides a precise snapshot of which processes hold which resources and which ones they are waiting for.
- Cycles and Deadlocks:
- For single-instance resources, a cycle in the RAG is a definitive sign of a deadlock.
- For multi-instance resources, a cycle indicates a potential deadlock, but further analysis is required.
In our next lesson, we will build directly on this foundation. We will focus on how to analyze a Resource Allocation Graph to detect deadlocks for single-instance resource types. We will use a systematic, tabular method similar to the one shown in the videos to prove whether a deadlock exists.