Hello! Welcome to the fourth lesson in our "Cluster Interaction and Troubleshooting" module.
In our last session, we mastered kubectl describe, a command that gives you the "what" and "why" from the Kubernetes cluster's perspective. You learned how to inspect events to understand why a Pod is Pending or in a CrashLoopBackOff state. As you saw, describe tells you that a container is restarting, but it can't tell you why the application code inside it is failing.
This lesson focuses on answering that question. We will dive into kubectl logs, the command that lets you peer inside a container and see what the application is writing to its standard output (stdout) and standard error (stderr). For a Platform Engineer, analyzing logs is the most direct way to debug application-level failures, making this an essential skill in your troubleshooting workflow.
1. Accessing Container Logs: The Basics
At its core, kubectl logs is your window into a running container's output streams. Since modern applications are designed to log to stdout and stderr (a best practice in the container world), Kubernetes automatically captures this output, making it available to you directly through the API server. You don't need to SSH into a node to find log files.
The basic syntax is straightforward:kubectl logs <pod-name>
Let's start with a video that demonstrates this fundamental usage and how it complements kubectl describe.
Kubectl Basic Commands - Create and Debug Pod in a Minikube cluster | Kubernetes Tutorial 18
This clip from "TechWorld with Nana" provides a clear, practical demonstration of the kubectl logs command and shows how to use it after checking a pod's status.
Please watch from 07:03 to 09:17. Notice how the command initially yields no output for the Nginx pod, but then shows detailed startup logs for a MongoDB pod. This illustrates that what you see depends entirely on what the application inside the container prints.
Key Considerations for Basic Usage
-
Multi-Container Pods: If your Pod has more than one container (e.g., an application container and a sidecar for log shipping), you must specify which container's logs you want to see. You do this with the
-c(or--container) flag:kubectl logs <pod-name> -c <container-name>Forgetting this is a common mistake that will result in an error.
-
Live Streaming: To monitor an application in real-time, you can stream its logs, much like using
tail -fon a Linux system. The-f(or--follow) flag is used for this:kubectl logs -f <pod-name>This is incredibly useful for observing application behavior as you interact with it.
2. Filtering Logs for Effective Analysis
Often, you'll be faced with thousands of log lines. Pouring through all of them is inefficient. kubectl logs provides several flags to help you narrow down the output to find exactly what you need.
Let's review the most important flags from a helpful article on the dev.to platform.
Kubectl Demystified: Mastering the `kubectl logs` Command
The article "Kubectl Demystified: Mastering the kubectl logs Command" provides an excellent, well-structured overview of the most common flags. It will serve as a great reference.
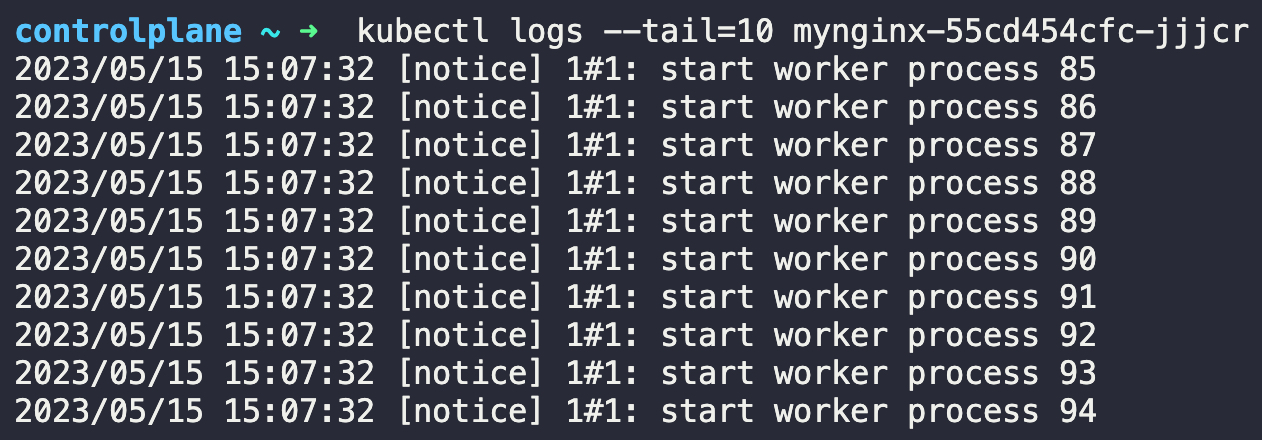
Please read through the "Examples with Explanations" section of this article. Focus on understanding the purpose of the following flags: -f (real-time streaming) --timestamps (adding timestamps) --tail (limiting output to the last N lines) --since (filtering by time)
Here are some visual examples of these flags in action:

3. The Most Critical Use Case: Debugging Crashing Pods
Remember the CrashLoopBackOff state from our last lesson? This is where kubectl logs truly shines. When a pod is in this state, running kubectl logs <pod-name> might return nothing. Why? Because the container crashes so quickly that the command connects to the new, running instance, which hasn't logged anything yet. The error that caused the crash is in the logs of the previous, terminated instance.
To access these crucial logs, you must use the --previous (or -p) flag.
kubectl logs <pod-name> --previous
This command is the key to solving the mystery of CrashLoopBackOff. The following short video provides some excellent tips, including a demonstration of the --previous flag.
Three `kubectl logs` tricks for saving time and keystrokes (100 Kubernetes Tools - Day 3)
This video from Robusta offers three time-saving tricks for using kubectl logs. The last one, on the --previous flag, is particularly important for debugging.
Please watch the segment on the --previous flag from 01:56 to 02:25. It clearly explains why and when you need to use it to see logs from a container that has crashed and restarted.
This troubleshooting flow is so fundamental that it's worth memorizing:
- See a pod in
CrashLoopBackOffwithkubectl get pods. - Run
kubectl describe pod <pod-name>to confirm it's restarting. - Run
kubectl logs <pod-name> --previousto find the fatal error in the application log.
Test your understanding!
A deployment named auth-service is running, but you suspect one of its pods is misbehaving. You run kubectl get pods and see one of the three auth-service pods has a RESTARTS count of 5. The pod is currently Running.
Which kubectl logs command would you run first to investigate the cause of the restarts, and why?
Show answer
The first command you should run is kubectl logs <pod-name> --previous.
The <pod-name> would be the specific name of the pod with 5 restarts (e.g., auth-service-7f8c9d...). The --previous flag is critical because the restarts indicate the container has crashed multiple times. The error that caused the most recent crash will be in the logs of the previous container instance, not the currently running one.
4. Advanced Usage: Aggregating Logs
As a Platform Engineer, you'll rarely care about just one specific pod. You'll need to see the logs from all pods belonging to a service or deployment. You can do this efficiently without first listing all the pods.
-
Using Label Selectors: The most robust method is to use a label selector (
-l). This will stream logs from all pods that match the label.# Stream logs from all pods with the label app=my-app kubectl logs -l app=my-app -f -
Using Resource Type: For resources like Deployments or DaemonSets, you can use a handy shortcut to get logs from one of its pods without knowing the full pod name. The Robusta video you watched earlier demonstrated this trick.
# Get logs from a pod managed by the 'my-app' deployment
kubectl logs deployment/my-app
This is great for a quick check, but be aware it only picks one of the pods. For a comprehensive view, the label selector method is generally preferred.
Conclusion
You've now learned how to use kubectl logs, moving from observing cluster state with describe to inspecting application behavior. This command is your direct line to understanding what your code is doing inside a container, making it indispensable for daily operations and incident response.
Key Takeaways:
kubectl logsfetches thestdoutandstderrstreams from a container.- Use
-fto stream logs in real-time, liketail -f. - The
--previousflag is essential for debuggingCrashLoopBackOfferrors by accessing logs from the terminated container instance. - Filter logs effectively using
--tailto see the last few lines and--sinceto view logs from a specific time window. - Aggregate logs from multiple pods using label selectors (
-l app=...) for a service-wide view.
So far, we've looked at a pod from the outside (describe) and read its output (logs). But what if logs don't give you enough information? Sometimes you need to get inside the container itself to check a configuration file, test network connectivity, or run a diagnostic tool. Our next lesson will cover kubectl exec, the command that gives you a shell inside a running container.