Hello! Welcome to the third lesson in our "Cluster Interaction and Troubleshooting" module.
In the last two lessons, you learned how to write the desired state to the cluster using kubectl apply and how to get a high-level summary of the actual state using kubectl get. You now know how to check if a deployment is ready or if a pod is running.
But what happens when kubectl get shows a problem, like a Pod stuck in Pending or CrashLoopBackOff? The summary tells you what is wrong, but not why. This is where kubectl describe comes in. This lesson is dedicated to helping you master this command to retrieve detailed information and events for a specific resource. For a Platform Engineer, kubectl describe is one of the most critical first-line debugging tools.
1. Beyond the Summary: Introducing kubectl describe
While kubectl get gives you a one-line summary, kubectl describe provides a detailed, human-readable report. It aggregates information about a resource's configuration, its current state, and—most importantly—a chronological list of events related to it.
Think of it this way:
kubectl get: Tells you a Pod'sSTATUSisImagePullBackOff.kubectl describe: Tells you why, by showing an event that saysFailed to pull image... repository does not exist or may require authorization.
This distinction is crucial for effective troubleshooting. To get a foundational understanding of the command, please start by reading the following article from Spacelift.
Kubectl Describe Command - Pods, Deployments & More
The article "Kubectl Describe Command" provides an excellent introduction to the purpose of kubectl describe and how it differs from other commands like kubectl logs.
Please read the sections "What is the kubectl describe command?" and "How to use kubectl describe with different resources". Focus on the comparison between describe and logs, and the idea that describe gives you a set of events to quickly diagnose issues.
The basic syntax is simple and follows the pattern you've already learned:
# Describe a specific pod
kubectl describe pod <pod-name>

# You can also use the shorthand for resource types
kubectl describe po <pod-name>

# Describe a deployment in a specific namespace
kubectl describe deployment <deployment-name> -n <namespace-name>
2. A Deep Dive into kubectl describe pod
The most common and powerful use of kubectl describe is on a Pod. Let's break down its output, as understanding its structure is key to using it effectively.
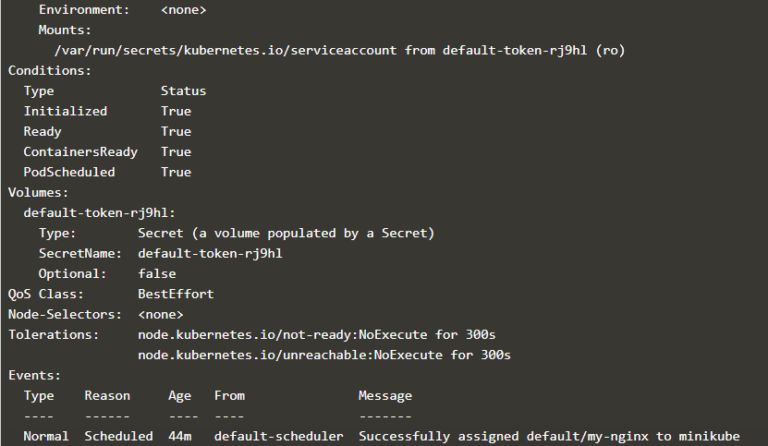
The output is typically divided into several key sections:
- Metadata: The top section shows basic information like
Name,Namespace,Labels,Annotations, and theNodethe Pod is scheduled on. - Status: The current phase of the Pod (
Running,Pending,Failed, etc.) and its IP address. - Containers: A detailed breakdown for each container within the Pod, including the
Imageused, its currentState(e.g.,Running), anyRestarts, and resource requests/limits. - Conditions: A series of True/False statuses that represent the lifecycle state of the Pod. Key conditions include:
PodScheduled: Was the scheduler able to assign this Pod to a Node?Initialized: Have all Init Containers completed successfully?ContainersReady: Are all main containers in the Pod reporting that they are ready?Ready: Is the Pod as a whole ready to serve traffic?
- Volumes: Information about any volumes mounted into the Pod's containers.
- Events: This is often the most valuable section for debugging. It's a time-ordered list of events that have affected the Pod, logged by various Kubernetes components. You'll see messages from the scheduler about placement decisions and messages from the kubelet on the node about pulling images and starting containers.
This short video provides a clear walkthrough of the describe pod command and its output.
Kubectl Basic Commands | Kubernetes for Beginners | Intellipaat
This clip from Intellipaat will give you a practical demonstration of kubectl describe pod and help you visualize the output sections we just discussed.
Watch from 21:21 to 22:29. Pay attention to how the presenter scrolls through the different sections of the output, pointing out the Node, Status, Conditions, and Events.
For a comprehensive reference on every field in the describe pod output, you can refer to the "Understanding the kubectl describe output" section of the Spacelift article (LINK) you read earlier. It's a great resource to bookmark.
3. Practical Troubleshooting Scenarios
Your work as a Platform Engineer often involves figuring out why an application isn't running correctly. kubectl describe is your first step in diagnosing these common issues.
The following video from "Java Home Cloud" is excellent because it demonstrates how to use kubectl describe to debug the three most common Pod failure scenarios.
Must Know kubernetes Pod troubleshooting commands | Kubernetes Debugging Pods | Troubleshooting k8s
This video walks through common Pod errors and shows exactly how kubectl describe reveals the root cause in its Events section. We'll watch it in three parts.
Please watch the following three segments: Diagnosing ImagePullBackOff (05:50 - 08:10): See how an incorrect image name leads to a clear "repository does not exist" error in the events. Diagnosing CrashLoopBackOff (09:46 - 12:04): Observe the repeating cycle of Pulling, Creating, and Starting events, which indicates a container that is exiting immediately after starting. Diagnosing Pending status (14:44 - 16:19): Watch how an invalid node selector results in a FailedScheduling event, telling you exactly why the pod couldn't be placed on a node.
These examples highlight a critical workflow:
- Use
kubectl get podsto see a Pod is in an error state. - Use
kubectl describe pod <pod-name>to find out why. - Focus on the
Eventssection for explicit error messages from Kubernetes components.
Test your understanding!
You use kubectl get pods and see a pod is in the CrashLoopBackOff state. You run kubectl describe on it.
What pattern would you expect to see in the Events section? And what does this pattern suggest about the next logical debugging step?
Show answer
In the Events section, you would expect to see a repeating sequence of Started container and Killing container (or similar) events from the kubelet. This indicates that Kubernetes is successfully starting the container, but the application inside it is crashing, causing Kubernetes to restart it according to its restart policy.
This pattern tells you the problem is likely inside the container, not with the Kubernetes configuration itself. Therefore, the next logical step is to inspect the application's logs using kubectl logs <pod-name>, which we will cover in our next lesson.
4. Describing Other Resources
While kubectl describe pod is the most common use case, you can use describe on almost any Kubernetes resource. The output is always tailored to be most useful for that specific resource type.
Here are a few other examples relevant to your role:
kubectl describe deployment <name>: Shows the deployment's selector, replica status (desired,current,available), rolling update strategy, and events related to scaling the underlying ReplicaSets. This is useful for debugging a stuck rollout.kubectl describe service <name>: Shows the service's selector, type, IP, and ports. Critically, it also shows theEndpoints, which are the actual Pod IPs the service is currently directing traffic to. If your application is unreachable, checking that theEndpointslist is populated and correct is a vital first step.kubectl describe node <name>: Provides detailed information about a worker node's health, including itsConditions(likeMemoryPressureorDiskPressure), its resource capacity and allocations, and a list of all Pods running on it. This is essential for diagnosing cluster-wide resource shortages or node-specific failures.
Conclusion
You have now added kubectl describe to your toolkit, moving from simply observing status to actively diagnosing problems. This command bridges the gap between seeing a problem with kubectl get and digging into application-specific issues with kubectl logs.
Key Takeaways:
kubectl describeprovides a detailed, human-readable overview of a Kubernetes resource, aggregating configuration, status, and events.- It is the primary command for understanding why a resource is in a particular state (e.g.,
Pending,CrashLoopBackOff). - The
Eventssection is the most critical part for troubleshooting, as it contains chronological messages from Kubernetes components like the scheduler and kubelet. - While most powerful for
Pods,describeprovides valuable, context-specific information for other resources likeDeployments,Services, andNodes.
In the case of a CrashLoopBackOff, describe tells you that the container is restarting, but it doesn't tell you why the application inside is failing. For that, we need to look inside the container at its standard output. Our next lesson will do just that, focusing on kubectl logs.