Good morning, Detective.

Our last case, "The Coach's Miracle Cure," revealed a crucial insight: by comparing Pearson and Spearman correlations, we deduced that the relationship between a couple's initial and final satisfaction was non-linear. This told us that a simple straight-line story was misleading, but it didn't give us a predictive tool to model how satisfaction changes.
Today, we open a new file: "The Fixed Survey." A rival consultancy, Elysian Partners, has been making waves, boasting unprecedented client satisfaction scores. Their marketing materials attribute this success to a single, proprietary "Key Factor" in their methodology. The claim is bold: master this one factor, and high satisfaction is virtually guaranteed. It sounds too simple, too clean. Our client, a skeptical industry watchdog, has provided us with a small, leaked internal dataset from Elysian. Our mission is to scrutinize their claim.
This lesson marks a shift in our investigative approach. We move from describing relationships with correlation to actively modeling them with regression. Our first objective is to test Elysian's central claim head-on. We will establish a baseline model to see just how much of the variation in client satisfaction can be explained by their much-touted "Key Factor" alone. This simple model will be the foundation upon which our entire investigation is built.
The First Interrogation: Building a Baseline Model
The leaked file contains data on a sample of Elysian's clients. For each client, we have their final Satisfaction score (0-100) and scores for several other metrics, including the Key_Factor_Score (0-50).
Here's the data we'll start with:
| Client ID | Key_Factor_Score (X) | Satisfaction (Y) |
|---|---|---|
| E-01 | 25 | 65 |
| E-02 | 30 | 70 |
| E-03 | 15 | 45 |
| E-04 | 45 | 95 |
| E-05 | 20 | 50 |
| E-06 | 35 | 68 |
| E-07 | 10 | 42 |
| E-08 | 40 | 85 |
| E-09 | 22 | 60 |
| E-10 | 28 | 72 |
Our first step is to model the relationship between the outcome we care about (the dependent variable, Satisfaction) and the supposed cause (the independent or predictor variable, Key_Factor_Score). This is the essence of Simple Linear Regression.
We are proposing a model of the form:
Here:
- is the intercept: the theoretical satisfaction score if the
Key_Factor_Scorewere zero. - is the slope: the change in
Satisfactionfor each one-point increase in theKey_Factor_Score. This coefficient is the heart of Elysian's claim. - is the error term or residual: the part of
Satisfactionthat our model can't explain. It's the difference between the actual observed satisfaction and the satisfaction predicted by our model.
The goal of our analysis method, Ordinary Least Squares (OLS), is to find the values for and that draw a line through the data points that minimizes the sum of the squared residuals.
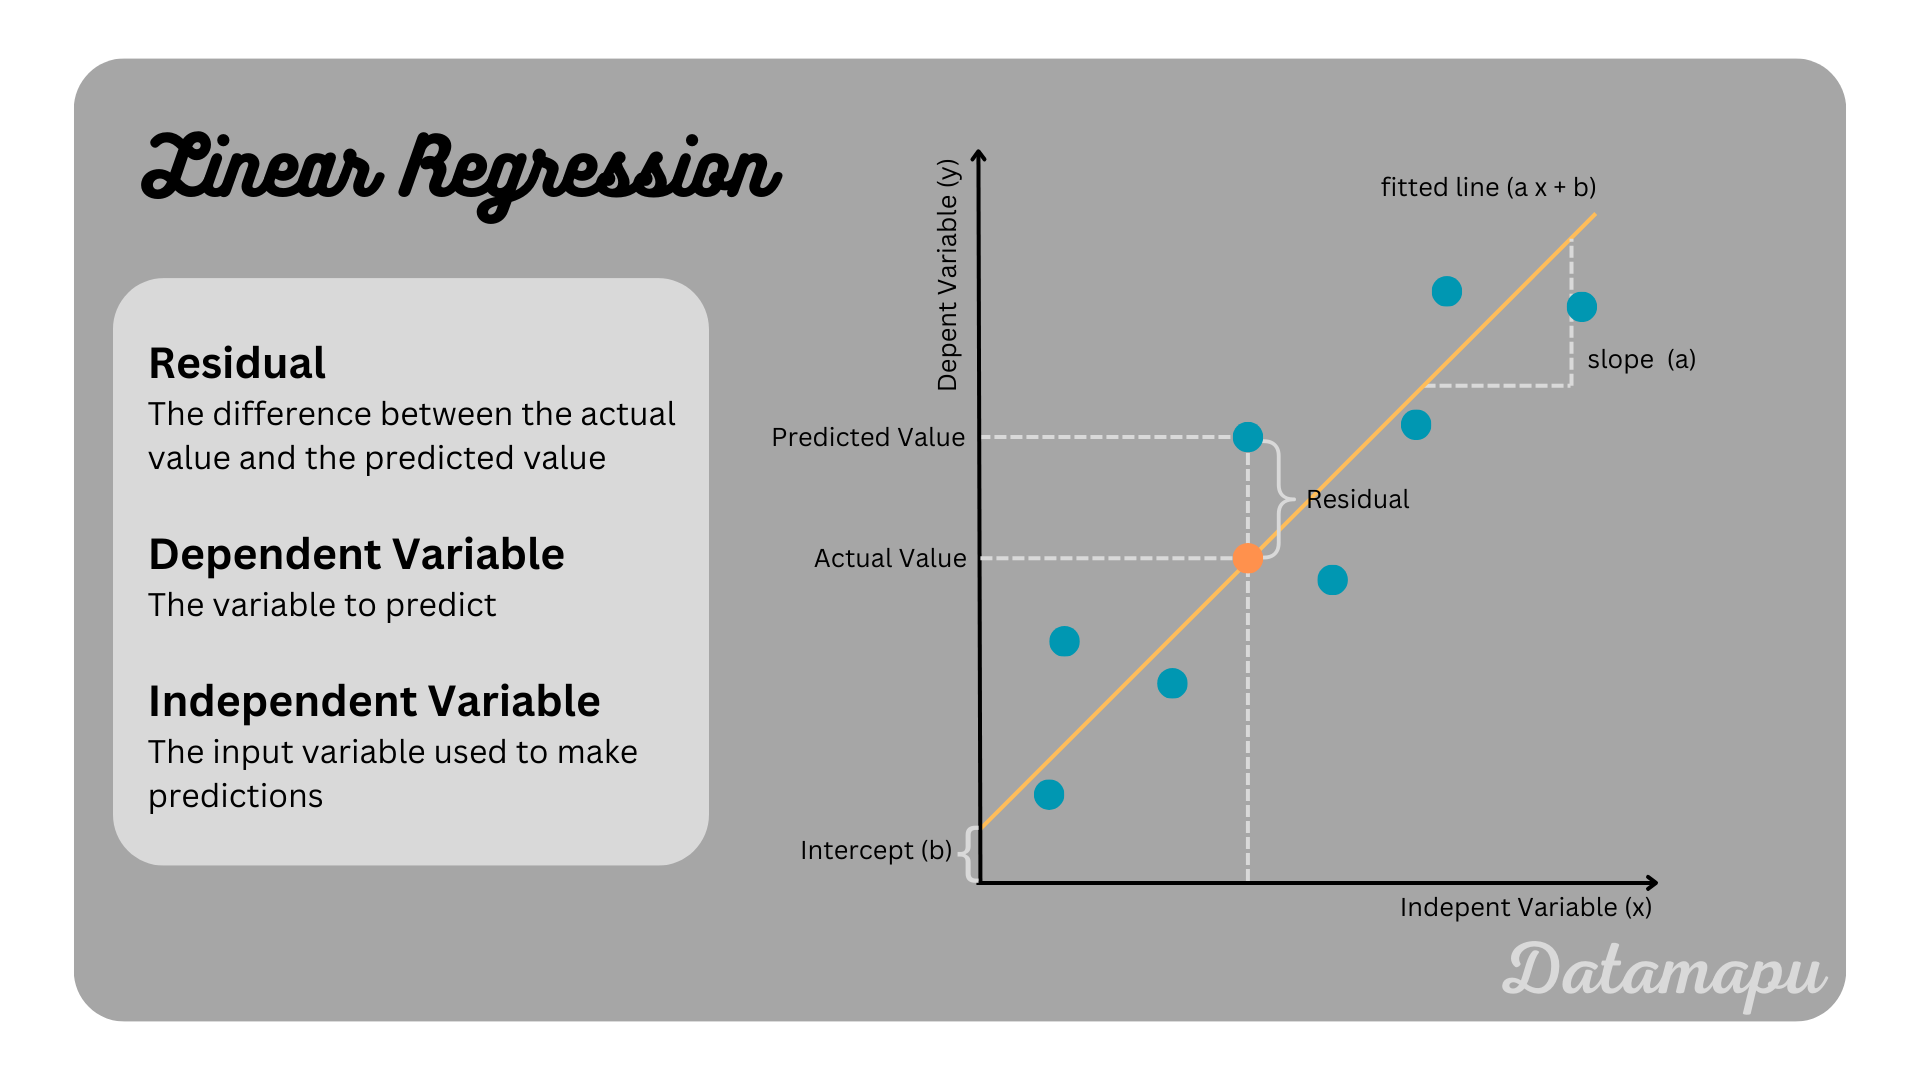
To solidify your understanding of this foundational technique, the following article provides a concise overview.
Using linear regression to establish empirical relationships
This article from IZA World of Labor frames linear regression as a tool for establishing empirical relationships, which is precisely our goal here. It provides a clear, high-level justification for our method.
Please read the two short paragraphs under the heading The meaning of a linear regression model. This section formally defines the components we just discussed. Then, read the section under the heading Ordinary least squares, which explains the principle of minimizing squared differences to find the best-fitting line.
Analyzing the Evidence: Interpreting the Regression Output
After running our data through a standard statistical package using OLS, we get the following output. This is our first forensics report. Every number is a clue.
SUMMARY OUTPUT

Regression Statistics
-------------------
R Square           0.895
Adjusted R Square  0.882
Observations       10

ANOVA
--------------------------------------------------
             df      SS          MS         F
Regression   1    2420.78     2420.78    68.59
Residual     8     282.22       35.28
Total        9    2703.00

Coefficients
------------------------------------------------------------------
                 Estimate   Std. Error   t Stat    P-value
Intercept         14.545       6.002      2.42     0.041
Key_Factor_Score   1.896       0.229      8.28    < 0.0001
Let's break this down systematically. The following video provides an excellent framework for interpreting regression results by asking four key questions. We will use it as our investigative guide.
Interpreting Linear Regression Results
This video by Dr. Sergio Garcia offers a practical, step-by-step guide to reading a regression output table, much like the one we have in our case file.
As you watch, focus on the four key questions the presenter outlines for analyzing the results. We will address each one in order. Pay attention to his explanations of R-squared, the Significance of F, and the interpretation of the coefficients and their p-values.
Guided by the video, let's dissect our evidence.
Question 1: How much of the story does this model explain? (R-Square)
- The Clue:
R Square = 0.895 - Interpretation: The R-squared value tells us the proportion of the variance in the dependent variable (
Satisfaction) that is predictable from the independent variable (Key_Factor_Score). In our case, approximately 89.5% of the variation in client satisfaction scores is explained by this single factor. - Initial Assessment: This is a very high number. On the surface, it strongly supports Elysian's claim. A single predictor explaining nearly 90% of the outcome is rare and powerful.
Question 2: Is the model valid at all? (F-statistic)
- The Clue: The F-statistic is 68.59, and its significance (p-value), not explicitly listed but derived from the F-statistic, is extremely small (far less than 0.05).
- Interpretation: The F-test assesses the overall significance of the model. It tests the null hypothesis that our model with one predictor is no better than a model with no predictors (i.e., just using the mean of
Satisfaction). The tiny p-value means we can confidently reject this null hypothesis. - Initial Assessment: The model is statistically significant. The relationship we've identified is not a random fluke. There is a real, systematic connection between the
Key_Factor_ScoreandSatisfaction.
Question 3: What is the nature of the relationship? (The Coefficient)
- The Clue: The
EstimateforKey_Factor_Scoreis1.896. - Interpretation: This is the estimated value for our slope, . Since it's positive, it indicates a positive relationship: as the
Key_Factor_Scoreincreases,Satisfactionalso increases. Specifically, for every one-point increase in theKey_Factor_Score, we predict client satisfaction will increase by about 1.9 points, on average. - Initial Assessment: This confirms the direction of the effect Elysian claims. The relationship is positive and the effect size seems meaningful.
Question 4: Is this specific predictor reliable? (Coefficient's P-value)
- The Clue: The
P-valueforKey_Factor_Scoreis< 0.0001. - Interpretation: This p-value tests the null hypothesis that the true coefficient () is zero. An extremely low p-value allows us to reject that null hypothesis.
- Initial Assessment: The
Key_Factor_Scoreis a highly statistically significant predictor ofSatisfaction. Its effect is not an illusion of the data.
Preliminary Conclusion
So far, the evidence seems to overwhelmingly support Elysian Partners. We've established a baseline model that is statistically significant, explains almost 90% of the variance in satisfaction, and is driven by a highly significant predictor that works in the direction they claim.
This is where a less experienced analyst might close the case. But for a detective, when things look too perfect, that's when you should be most suspicious. The numbers are almost too good. A single factor explaining this much variance in a complex human outcome like relationship satisfaction is highly unusual.
To add another perspective, let's look at a practical example of regression from Pew Research.
A short intro to linear regression analysis using survey data
This article from Pew Research demonstrates a bivariate regression on real-world survey data. It's a good example of how these models are used in practice and how coefficients for different groups are interpreted relative to a baseline.
Read the section titled Bivariate regression. Notice how they start with one predictor (race) and interpret the coefficients for each category relative to the reference category ("White non-Hispanic"). This reinforces the idea of establishing a simple, interpretable baseline before making things more complex.
Our investigation has established a strong, statistically significant baseline. The "Key Factor" is undeniably a powerful predictor in this dataset. But the strength of this relationship is, in itself, a red flag. Is it plausible? Or is it a sign that the data we're looking at has been curated, manipulated, or "fixed"?
Summary of Today's Investigation
- Objective: We opened the "Fixed Survey" case to investigate Elysian Partners' claim that a single "Key Factor" drives client satisfaction. Our first step was to build a simple linear regression model to serve as a baseline.
- Method: Using Ordinary Least Squares (OLS), we modeled
Satisfactionas a function ofKey_Factor_Score. - Evidence: We analyzed the regression output, focusing on four key clues:
- R-squared: The model explains a very high percentage (89.5%) of the variation in satisfaction.
- F-statistic: The overall model is highly significant, indicating a real relationship.
- Coefficient Estimate: The relationship is positive, as claimed.
- Coefficient p-value: The predictor is highly significant.
- Conclusion: The baseline model appears to strongly validate Elysian's claims. However, the sheer strength of the finding is suspicious and warrants deeper investigation.
Preview of the Next Lesson
Our baseline model is like a confession obtained under duress—it seems to say what we expect, but is it the whole truth? The suspiciously high R-squared value suggests that we might be looking at a carefully constructed narrative, not the messy reality. To challenge this narrative, we need to introduce other potential culprits.
In our next session, we will bring in the other variables from the case file—Communication_Frequency, Shared_Activities, and Years_Together—to build a multiple linear regression model. By seeing how the importance of the Key_Factor_Score changes when other predictors are in the room, we can determine if it's truly the star of the show or merely a well-cast decoy.