Welcome back, Detective.
Our investigation has reached a critical phase. In the last two sessions, we navigated a storm of raw data. First, we used Principal Component Analysis to distill thirty chaotic behavioral metrics into two potent indicators: an "Agitator" score (PC1) and an "Influencer" score (PC2). Then, using clustering algorithms, we partitioned our suspects based on these scores, revealing distinct operational cells. One group, the "Shadow Crew," stood out. Their combination of high agitation and high influence marks them as the likely inner circle of our mastermind.
We've isolated the crew; now we must decode their strategy. What makes them tick? Which levers do they pull to achieve their goals, and which are most effective? Answering these questions is the key to anticipating their next move and cornering the mastermind. Today, we build our primary analytical weapon for this task: a predictive model focused exclusively on the Shadow Crew. By modeling their actions, we will transform their behavioral patterns into a quantifiable strategy.
The Anatomy of a Strategy
At its core, any strategy is about allocating resources (our inputs) to achieve a desired outcome. For our Shadow Crew, let's imagine we've gathered data on several of their past "operations." For each operation, we have data on the resources they deployed and the resulting "Impact Score"—a metric we've devised to measure the operation's success.
Our goal is to find a mathematical relationship between these inputs and the outcome. This is the domain of Multiple Linear Regression (MLR). While simple linear regression models an outcome based on a single predictor, multiple regression allows us to use several predictors simultaneously. It's the perfect tool for understanding a complex system with many moving parts, like a criminal strategy.
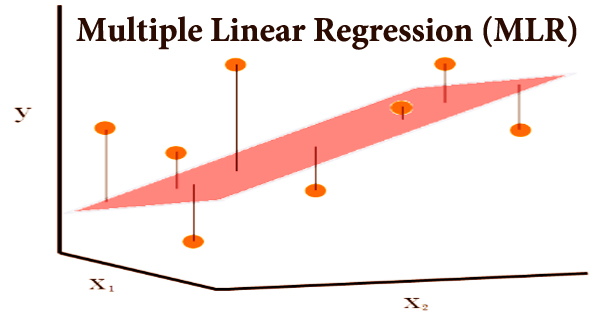
The model assumes that the outcome (Impact Score) is a linear combination of the various strategic inputs. For two predictor variables, say (e.g., Online Disinformation Effort) and (e.g., Financial Anomaly Score), the model tries to find the best-fitting plane through the data points in three-dimensional space.
Let's formalize this.
Multiple Linear Regression Analysis: A Matrix Approach ...
This paper by Scott H. Brown provides a concise and clear introduction to the multiple linear regression model, framing it in the matrix notation that will be familiar to you from your background in statistics.
First, read the introductory section, "The general model for k variables". This establishes the basic equation. Then, review the section "A Matrix Approach", which shows how this equation is elegantly expressed using matrix notation as Y = X\beta + \epsilon.
In our case:
- Y is the n x 1 vector of "Impact Scores" from n past operations.
- X is the n x (k+1) matrix of our k "strategic input" variables for each operation (plus a column of ones for the intercept).
- β is the (k+1) x 1 vector of unknown regression coefficients. These coefficients are what we need to find; they represent the core of the mastermind's strategy.
- ϵ is the n x 1 vector of random errors—the part of the Impact Score our model can't explain.
Cracking the Code: The Normal Equations
How do we find the best values for the coefficients in β? We use the method of Ordinary Least Squares (OLS), which aims to find the coefficient values that minimize the sum of the squared errors (the squared lengths of those vertical lines in the image above).
Given your background, you know that this minimization problem has a beautiful closed-form solution when expressed in matrix algebra. This solution is known as the normal equation.
Multiple Linear Regression Analysis: A Matrix Approach ...
The same paper now walks through the derivation and application of the OLS solution. This is the numerical engine of our investigation.
First, read the section that derives the famous formula by solving the least squares normal equation. This leads to the solution \hat{\beta} = (X^T X)^{-1} X^T Y. Then, walk through the concrete numerical example. Observe how the matrices X and Y are constructed and how the formula is applied step-by-step to calculate the coefficient vector \hat{\beta}.
By applying this formula to the data from our suspect cluster, we can compute the estimated coefficient vector, . This vector is our first draft of the mastermind's playbook.
Decoding the Playbook: Interpreting the Coefficients
Finding the numbers is only the first step. The real detective work lies in interpreting them. Each coefficient in our vector tells a story about the crew's strategy.
A key concept here is that of a partial regression coefficient. In multiple regression, each coefficient's interpretation comes with a crucial caveat: "holding all other variables constant."
This video provides an excellent walkthrough of how to interpret the numbers you'll get from a regression output.
Multiple Regression | Coefficients – Interpretation, C.I, Hypothesis Testing
This video, "Multiple Regression | Coefficients – Interpretation, C.I, Hypothesis Testing," clearly explains how to translate the raw numbers from a regression model into meaningful insights.
Watch the segment from interpreting coefficients. The speaker explains, for example, that a coefficient of 0.113 for house size means a $113 increase in price for homes with the same number of rooms, same age, and same distance. This "ceteris paribus" (all else equal) condition is the cornerstone of interpreting our mastermind's strategy.
So, if the coefficient for "Online Disinformation Effort" is +5.2, it means that for every one-unit increase in their disinformation campaign, the operation's Impact Score is expected to increase by 5.2 points, assuming their financial activity and recruitment levels remain the same. This allows us to isolate the unique contribution of each strategic lever.
Comparing Apples and Oranges: Standardized vs. Unstandardized Coefficients
This brings us to a critical question: which factor is most important to their strategy? Let's say our predictors are:
- : Online Disinformation Effort (measured in "engagement units")
- : Financial Anomaly Score (measured in dollars)
A coefficient of +5.2 for and +0.01 for doesn't automatically mean disinformation is more important. The scales are completely different. To compare their relative importance, we need to put them on a common scale. We do this by calculating standardized coefficients.
Interpreting Multiple Regression Coefficients | Linear... - Fiveable
This guide from Fiveable offers a perfect breakdown of the two types of coefficients and their uses.
Read the sections Unstandardized vs. Standardized and Assessing Relative Importance. Pay close attention to the distinction: Unstandardized (b): Interpretable in original units. Good for prediction. Standardized (β): Unit-free. Good for comparing the relative strength of predictors.
If the standardized coefficient for disinformation () is 0.65 and for financial anomalies () is 0.30, we can now confidently say that disinformation has more than double the strategic weight in their model of success. This is how we "quantify the factors driving their strategy."
Validating Our Intelligence
Before we can trust our model to predict the crew's next move, we must assess its quality. Is it a reliable tool, or just statistical noise? We look at a few key indicators.
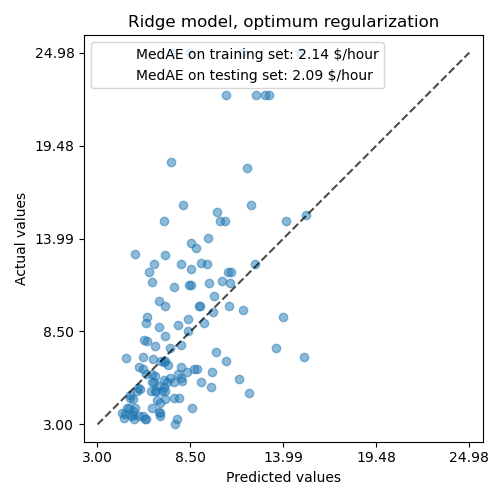
Here are the key questions we need to ask, which are covered in the following video:
- Does the model work at all? We use the F-statistic to test if our set of predictors, as a whole, explains a significant amount of the variation in the Impact Score.
- Which factors matter? We use t-tests for each individual coefficient to see if its contribution is statistically significant or if it could just be due to random chance.
- How much does it explain? The R-squared () value tells us the proportion of the variance in the Impact Score that our model can explain. An of 0.75 means we can account for 75% of why some operations succeed more than others.
Multiple Regression - Interpretation (3of3)
This video, "Multiple Regression - Interpretation (3of3)," provides a tour of a typical regression output, showing how to find and interpret these key diagnostic metrics.
First, see how to check for overall model significance using the F-statistic. Then, look at how to assess individual variable contributions with their t-tests. The video also explains R-squared and its adjusted version. Finally, the segment on interpreting coefficients provides another excellent example of putting it all together.
Predicting the Next Move
Once we have a validated model, we have a powerful predictive tool. Our final regression equation will look something like this:
Now, if our surveillance picks up chatter indicating the crew is planning an operation with specific levels of disinformation, financial movement, and stealth, we can plug those values into our equation. The result is a quantitative prediction of how impactful their next move will be, allowing us to allocate our own resources proactively.
This is the ultimate goal of our analysis: to move from reacting to the mastermind's actions to anticipating them.
Conclusion
Today, we've taken a significant step from identification to prediction. By focusing our analytical lens on the "Shadow Crew," we've laid the groundwork for building a multiple linear regression model of their strategic behavior. This model is more than just an equation; it's a window into the mind of our adversary.
Key Takeaways:
- Multiple Linear Regression (MLR) allows us to model a single outcome variable using multiple predictor variables.
- The model coefficients () can be estimated using the matrix formula .
- Unstandardized coefficients are used for making predictions in the original units of the data.
- Standardized coefficients are used to compare the relative importance of each predictor in the strategy, holding all other factors constant.
- We assess the model's quality using the overall F-test, individual t-tests for each coefficient, and the R-squared value.
- A validated model allows us to predict future outcomes based on the inputs, turning our analysis into actionable intelligence.
Preview of the Next Lesson
We have now developed all the components of our investigation. We used PCA to find the signal in the noise, clustering to identify the key players, and regression to build a predictive model of their strategy. In our final session, we will put it all together. We will synthesize the evidence from all three analyses to construct a comprehensive profile of the mastermind and their operation, leading us to the final gambit to close the case.