Welcome, Detective. A new file has just landed on your desk, marking the beginning of a case that will take our investigation into a new dimension: time.
In our previous inquiries, we focused on static evidence—analyzing satisfaction scores, spending habits, and engagement metrics from fixed snapshots of data. You masterfully used inequalities to establish hard bounds on claims from incomplete records. But many of the intrigues at Elysian Moments and its rivals don't just exist; they unfold. Patterns emerge, rhythms are broken, and conspiracies are often hidden not in the numbers themselves, but in the timing of their appearance.
This brings us to Case File #7: The Booking Pattern Conspiracy. Our attention has been drawn to a rival studio, "Aphrodite's Veil," which has been aggressively promoting its new "Forbidden Fruit" boudoir package. This morning, they issued a press release boasting of a "record-breaking surge in interest," claiming they received 15 booking requests in a single hour yesterday afternoon. Their typical average for that time slot is a respectable 5 requests per hour.
Is this a genuine marketing triumph, or is the timing too perfect? Could the surge be manufactured—perhaps by bots or fake accounts—to create a false impression of success? To crack this case, we need to move beyond simple averages and ask a more sophisticated question: what is the probability of an event like this happening by pure chance?
Today, we will develop our first tool for temporal analysis. We will learn to model the arrival of random events over time, allowing us to quantify just how "surprising" a given frequency of events truly is. This will enable us to determine whether that burst of 15 bookings is a plausible outlier or a statistical red flag.
Modeling Random Arrivals
To assess the studio's claim, we first need a model for how booking requests should arrive under normal circumstances. These events—phone calls, web form submissions—seem to happen randomly. Yet, over a long enough period, they occur at a somewhat stable average rate. This describes a fundamental type of stochastic process.
The key assumptions for this model are:
- Independence: The arrival of one booking request does not influence the arrival of another. (e.g., clients aren't arriving in coordinated groups).
- Constant Rate: The average rate of arrivals is constant over the time interval of interest.
- Non-simultaneity: Two requests cannot arrive at the exact same instant.
When these conditions hold, we are dealing with a Poisson Process. The following video provides an excellent overview of this concept.
This video, "What is a Poisson Process?" from Iain Explains Signals, Systems, and Digital Comms, introduces the core ideas behind modeling discrete random events in time.
Please watch the first four minutes. Pay close attention to the characteristics of the process and how it's different from a continuous random process. Then, focus on the introduction of the Poisson distribution formula in the next segment, which is the mathematical tool we'll use to calculate probabilities.
As the video explained, the Poisson distribution gives us the probability of observing a specific number of events in a fixed interval. The formula for its probability mass function is:
Where:
- is the number of events we are interested in (in our case, 15 bookings).
- (lambda) is the expected or average number of events in that same interval (in our case, 5 bookings).
- is the base of the natural logarithm (approximately 2.71828).
It's crucial that represents the average for the specific interval length you are analyzing. If you have a rate per hour, you must use that same hour-long interval for your observation .
Quantifying the Anomaly
Now, let's apply this to the case. We want to know how likely it is to see 15 bookings () in an hour when the average is 5 (). Is this a "one in a million" event, or something more common?
The following article directly addresses using the Poisson distribution for this exact purpose: anomaly detection.
Anomaly Detection with the Poisson Distribution
This article from Anomaly.io provides a practical, clear-cut guide to applying the Poisson distribution to find unusual event frequencies.
Read the introduction, Traditional Anomaly Detection, to frame the problem. Then, study Example 1 carefully. It shows how to calculate probabilities for rare events. Finally, read the section on assumptions near the end to reinforce the conditions required for our model to be valid.
As the article demonstrates, calculating the probability of exactly 15 bookings is interesting, but what's more relevant for an investigation is the probability of observing 15 or more bookings. This tells us the likelihood of seeing an outcome at least as extreme as the one being claimed.
Let's do the calculation for Aphrodite's Veil. We have and we want to find . This is equivalent to . Using a statistical calculator or software (like the ppois function in R mentioned in the article), we find:
- Probability of 14 or fewer bookings:
- Probability of 15 or more bookings:
A probability of 0.0002 means there is roughly a 1 in 5000 chance of this happening randomly. While not strictly impossible, it is highly improbable. This is a strong statistical clue that the surge might not be organic.
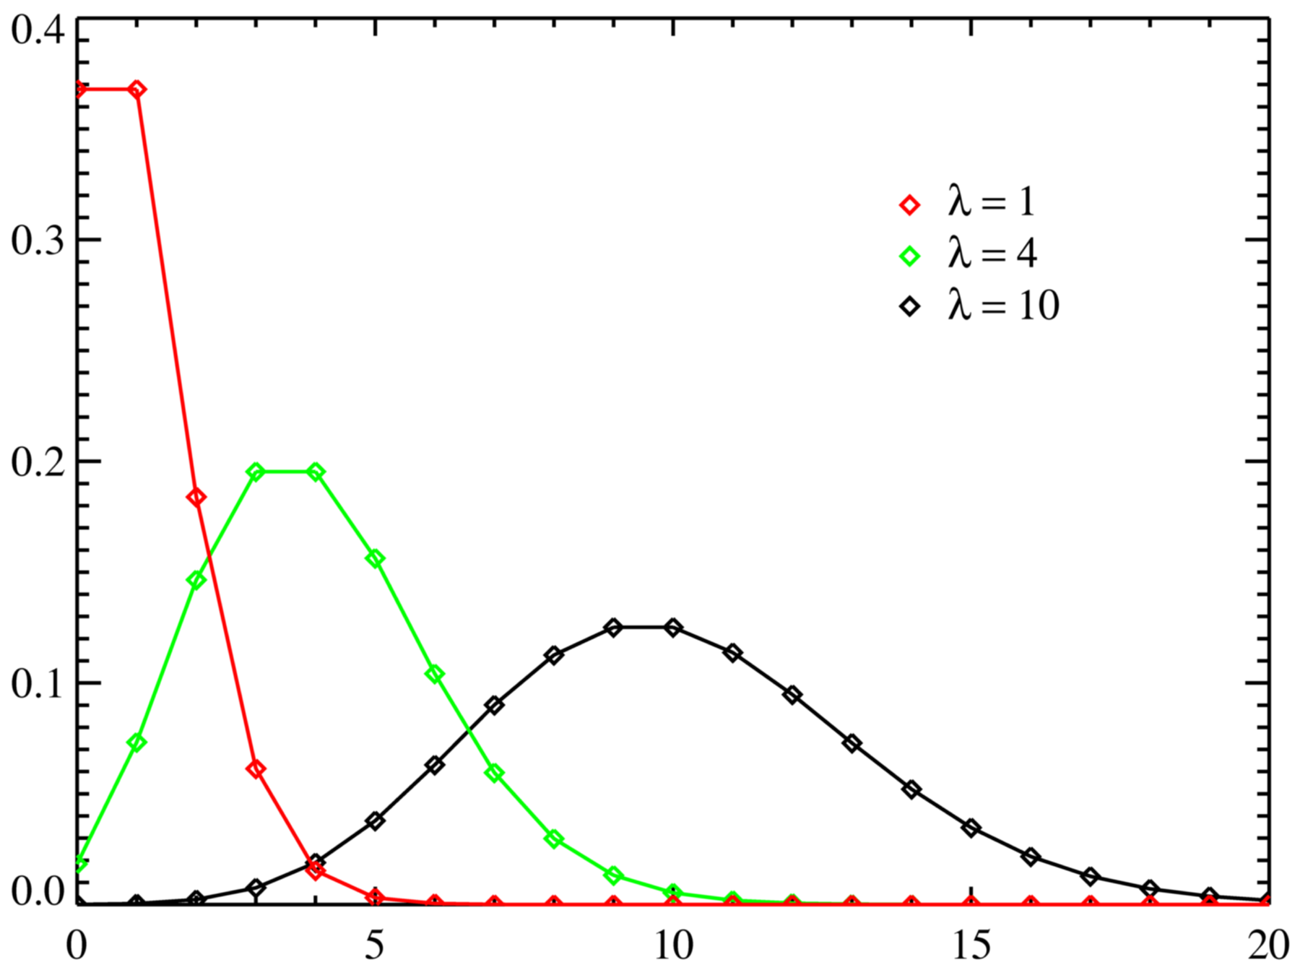
The graph below shows the shape of the Poisson distribution for different rate parameters (). You can see our scenario corresponds to the green curve (, which is close to our ). Notice how quickly the probability drops to near zero for values far from the mean. The black curve () is more spread out, and the red curve () is highly skewed.
Measuring "Surprise"
The concept of a rare event being "surprising" can be formalized. This gives us a more rigorous way to talk about anomalies.
6 Density-based methods – That's weird! Anomaly ...
This chapter from the online book "That's weird! Anomaly Detection using R" introduces a formal way to measure how anomalous an observation is.
First, read the brief introduction to understand the density-based approach. Then, study the section on Surprisals, which defines this measure. Finally, review the specific formula provided for the Poisson distribution.
As defined in the text, the surprisal, , of an observation is its negative log-probability: . A higher surprisal value corresponds to a lower probability and thus a more anomalous event.
For a Poisson distribution, the surprisal of observing events when the mean is is:
Let's calculate the surprisal for the studio's claim ():
Compare this to the surprisal of observing the average number of bookings ():
The surprisal score for 15 bookings is over five times higher than for 5 bookings, quantitatively confirming our intuition that it is a much more "surprising" event.
Conclusion
Our first step into temporal analysis has yielded a powerful forensic tool. By modeling the arrival of booking requests as a Poisson process, we can move beyond gut feelings and rigorously test claims about event frequencies.
Here are the key findings for your case file:
- The Model: A Poisson process is an effective model for events that occur independently and at a constant average rate over time.
- The Tool: The Poisson probability formula, , allows us to calculate the probability of observing a specific number of events () in an interval, given the average rate ().
- The Clue: The probability of Aphrodite's Veil receiving 15 or more bookings in an hour by chance is approximately 0.02%, or 1 in 5000.
- The Verdict: While we cannot declare it impossible, the observed event is statistically highly improbable. This provides strong grounds to suspect that the surge in bookings was not organic. Further investigation into the source of these requests is warranted.
Preview of the Next Lesson
We have successfully analyzed the number of bookings in a given time window. But this is only half of the story. The Poisson process has a dual nature. What about the time between each booking? A sudden burst of 15 requests in an hour implies that the gaps between them must have been suspiciously short.
In our next session, we will investigate this other side of the coin. We'll use the exponential distribution to model the waiting times between events, allowing us to ask if the gaps themselves are anomalous. This will give us a second, independent way to scrutinize the booking patterns at Aphrodite's Veil.