Welcome back, Detective. Our investigation has reached a critical juncture. We've established that the sudden flood of 15 bookings in a single hour at Aphrodite's Veil was a statistical anomaly, both in its sheer volume and in the frantic pace of arrivals. However, so far we've treated this flood as a single, monolithic event. This is like finding a body with multiple wounds but not examining which wound was fatal.
Aphrodite's Veil, like any modern business, has several streams of client interaction. Bookings arrive via three distinct channels:
- Direct Phone Calls: The traditional method.
- The Studio Website: An online booking portal.
- "VixenValet": A popular third-party luxury services app.
A genuine surge in interest might cause a proportional rise across all channels. A targeted attack, however, would likely concentrate on a single point of entry. Today, our mission is to dissect the aggregate data stream. We will learn how to break apart and reconstruct these event flows to see if the anomaly is uniform or if it's concentrated in a way that reveals the saboteur's chosen weapon.
Combining Forces: The Superposition Principle
Before we can spot an anomaly within a channel, we must first understand the normal, combined flow of traffic. The studio's records show the average booking rates for each channel under normal operating conditions:
- Phone Calls (): 1 booking per hour
- Website Portal (): 2 bookings per hour
- VixenValet App (): 2 bookings per hour
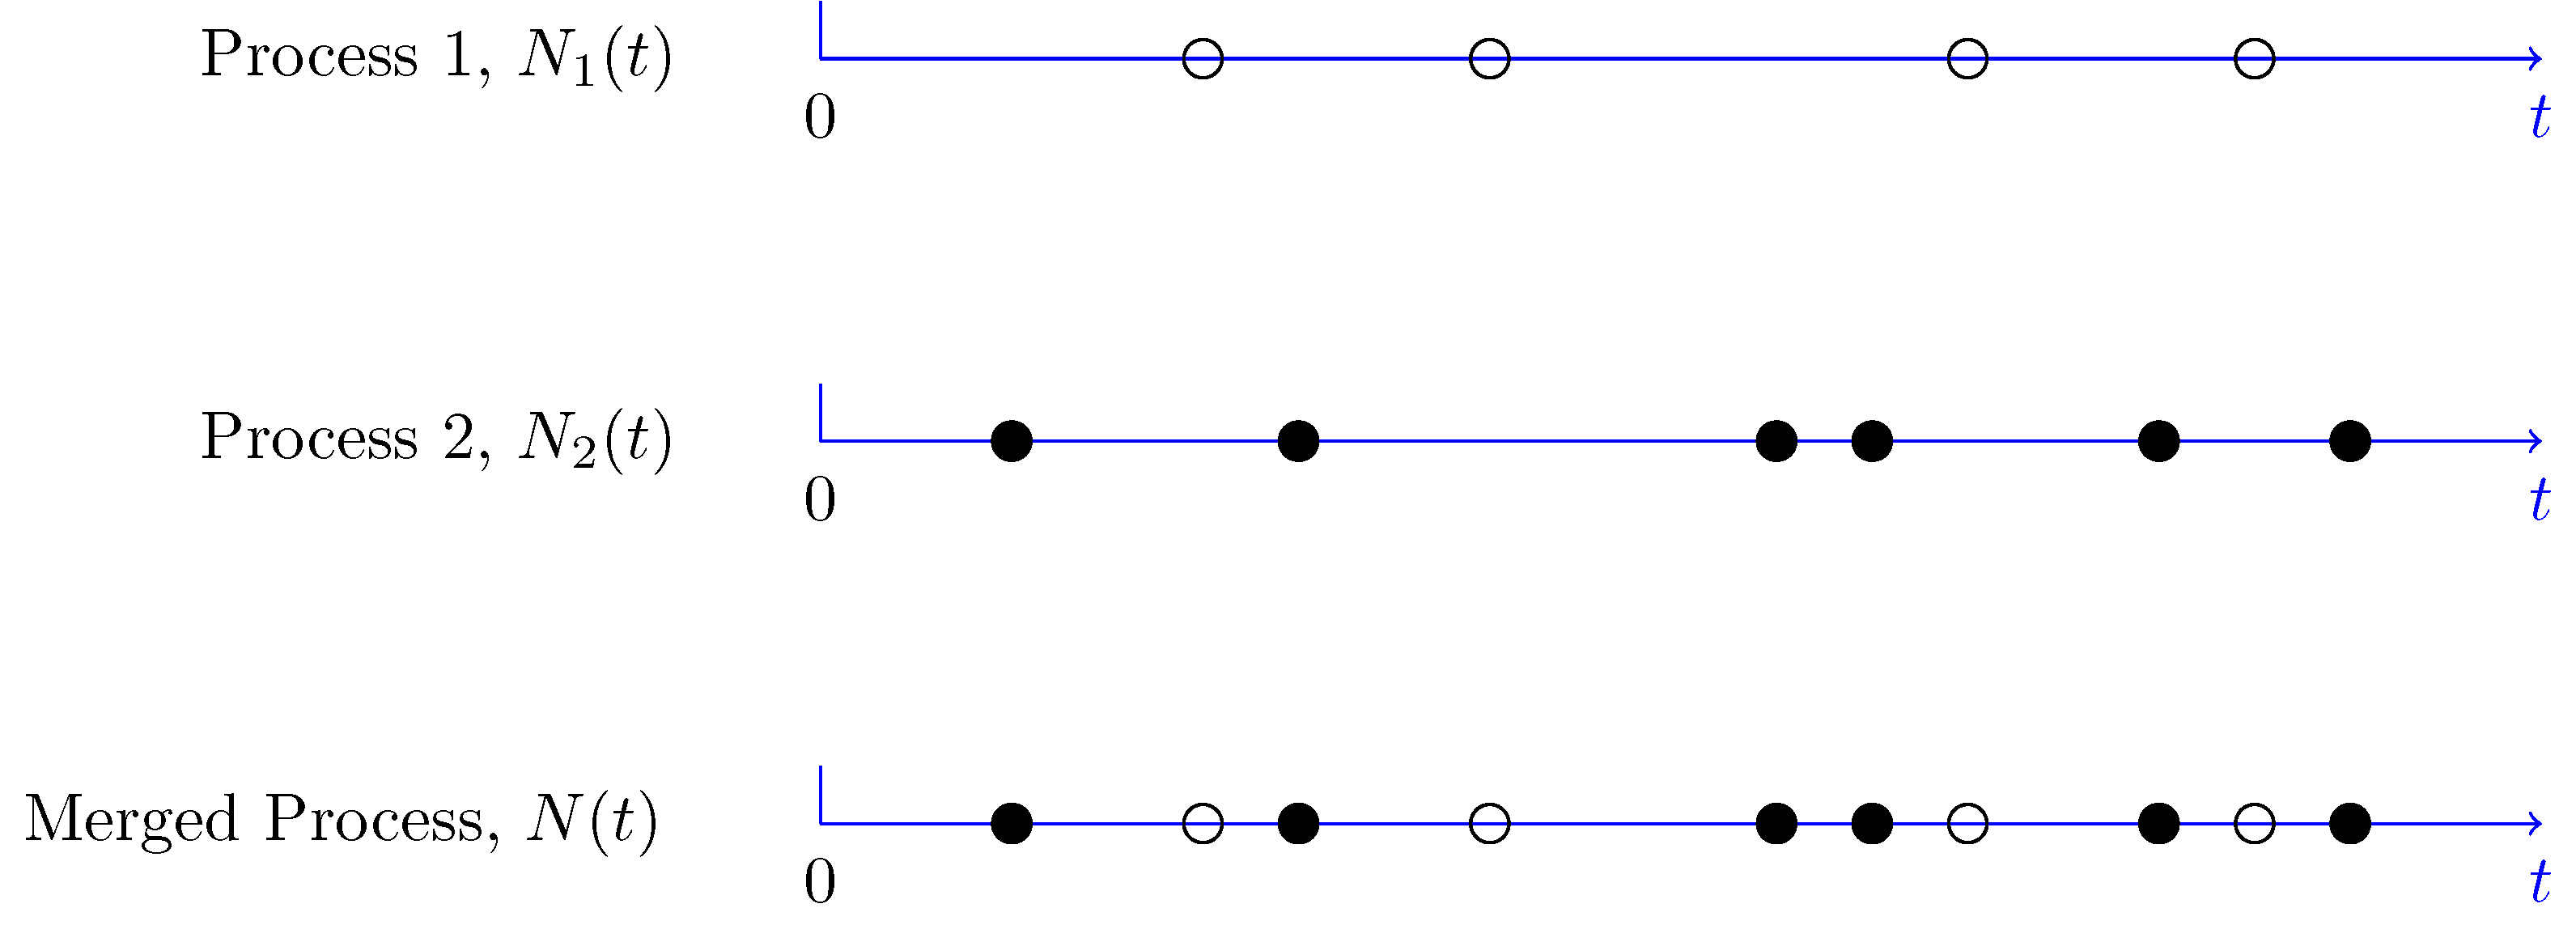
If we assume these three streams of arrivals are independent (a reasonable assumption, as a client calling is unlikely to affect another client using the app), we can combine them. This is known as superposition. A fundamental property of Poisson processes is that the sum, or merger, of independent Poisson processes is itself a Poisson process. The rate of this new merged process is simply the sum of the individual rates.
This is a powerful concept, elegantly summarized in the following resources.
This segment from the video "What is a Poisson Process?" provides a clear, intuitive explanation for why the sum of Poisson processes is also a Poisson process.
Watch the section discussing the sum of Poisson variables. The example of different types of network traffic (voice, video) merging into a single switch is directly analogous to our case of different booking channels merging into a single studio schedule.
For our case, the total normal booking rate, , is:
This confirms the baseline rate we've been using in our previous analyses. It shows how the overall picture is built from its constituent parts.
The image below provides a visual representation of this merging process.
The following text provides a more formal definition and examples of superposition.
Lesson 10. Poisson Processes – Decomposition and Superposition
This document from a course on stochastic processes covers the core mathematical properties we're using today.
Please read the section titled Superposition property for the formal rule. Then, review Example 4 and Example 5 to see how this principle is applied to combine customer arrivals at a bank and sales orders from different salespeople.
Divide and Conquer: The Decomposition Principle
Now for the crucial step: working backward. We know the total number of bookings in the anomalous hour was 15. The studio's server and phone logs give us the breakdown:
- Phone Calls: 1 booking
- Website Portal: 13 bookings
- VixenValet App: 1 booking
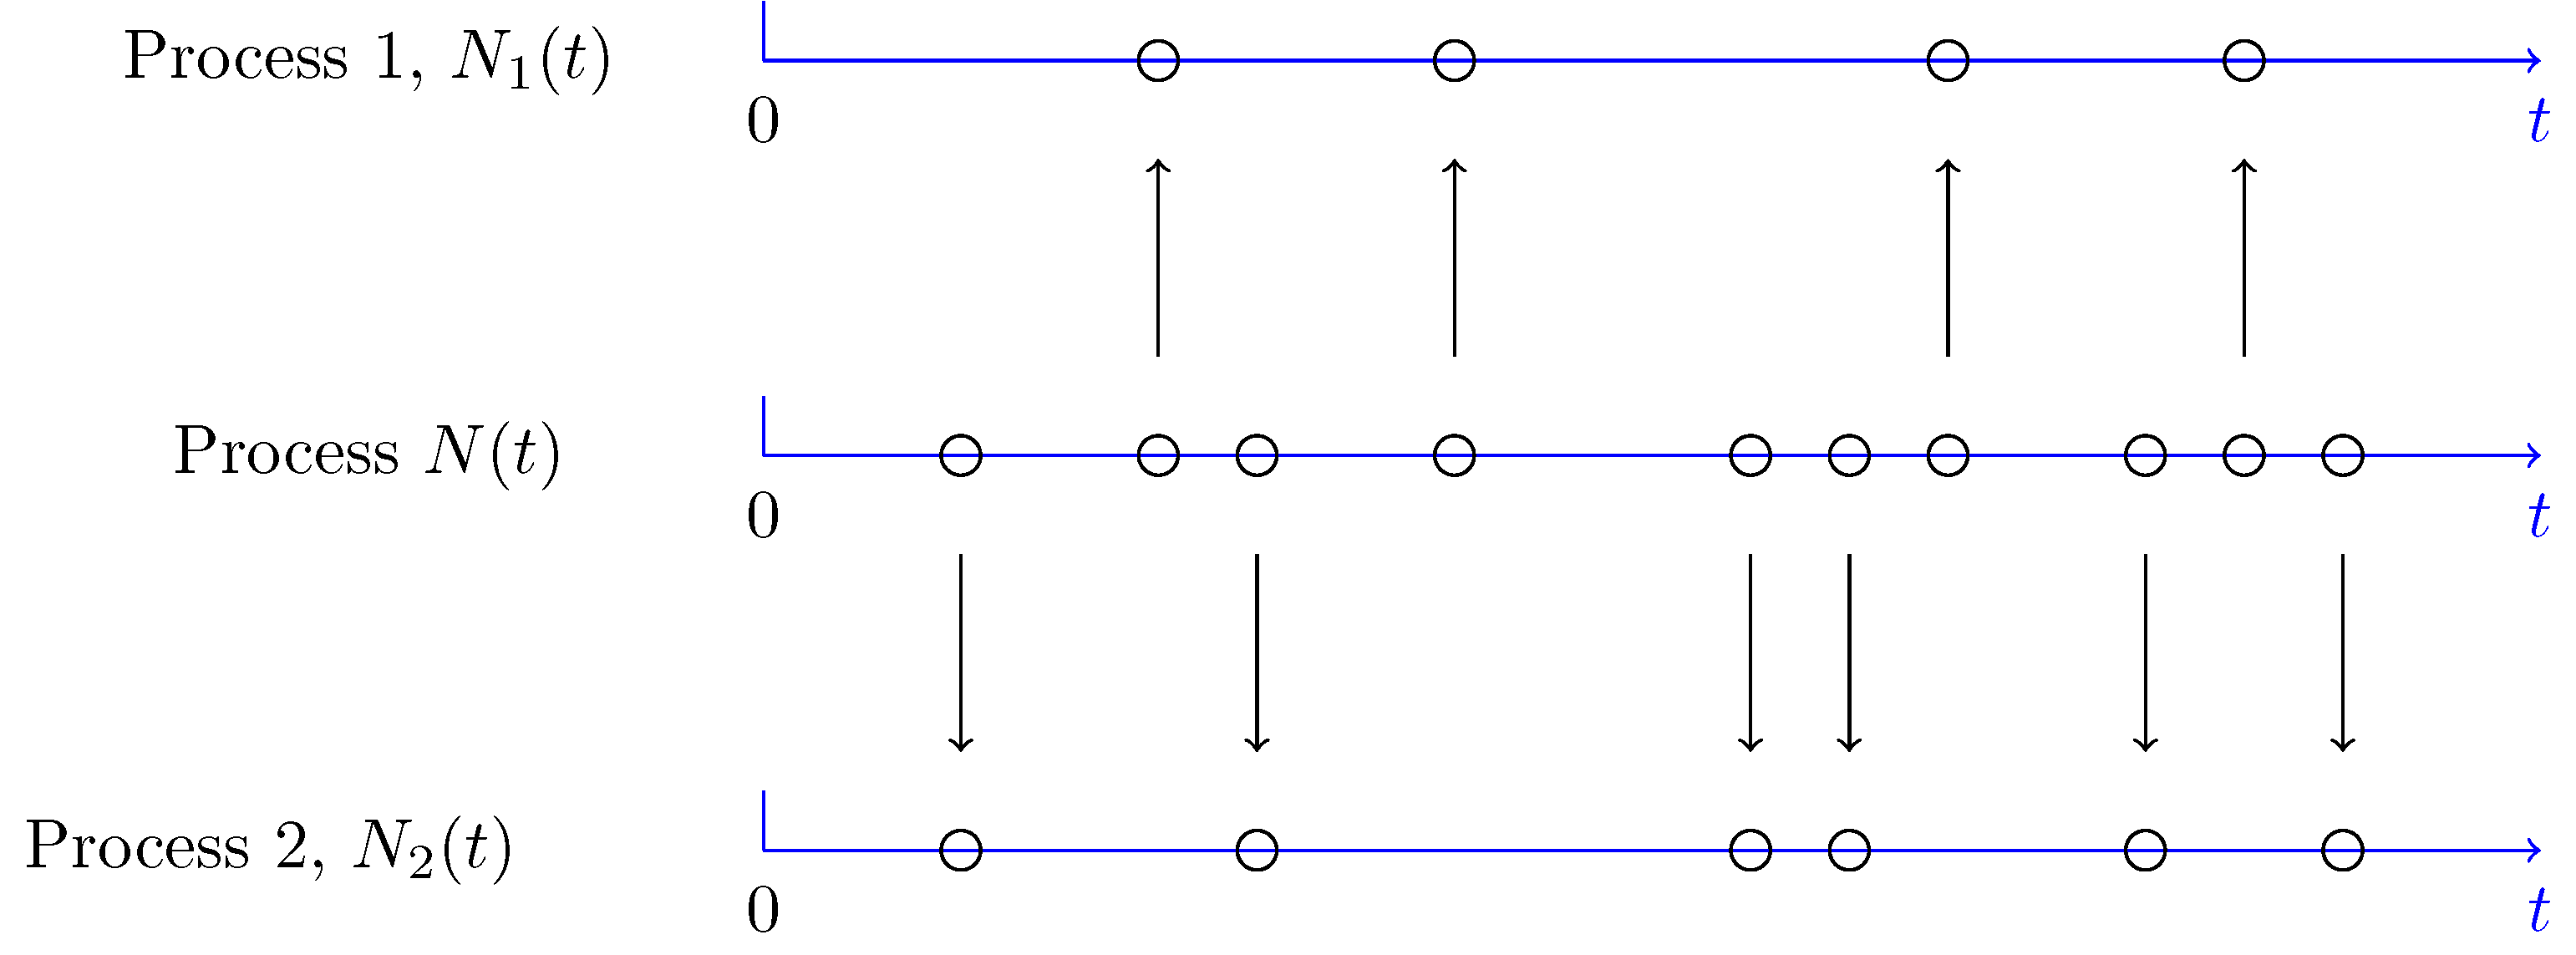
This distribution seems lopsided. To quantify this, we use the principle of decomposition, also known as thinning or splitting. If events in a Poisson stream can be classified into different types with fixed probabilities, then the stream for each type is also an independent Poisson process.
First, let's find the normal probability that a given booking comes from each channel:
- (20%)
- (40%)
- (40%)
If the sudden surge to 15 bookings were a natural, across-the-board increase in client interest, we would expect this 20/40/40 split to be roughly preserved. The expected number of bookings from each channel would be:
- Expected from Phone:
- Expected from Website:
- Expected from App:
The Clue:
Let's compare the expected distribution to the observed one:
| Channel | Expected Bookings | Observed Bookings |
|---|---|---|
| Phone | 3 | 1 |
| Website | 6 | 13 |
| VixenValet | 6 | 1 |
The discrepancy is stark. The website channel received more than double its expected share, while the other two channels received far less. This is our strongest piece of evidence yet. It suggests the anomaly is not a simple scaling of normal behavior, but something else entirely.
The image below illustrates this splitting principle.
The same resource from before also provides the formal basis for this technique.
Lesson 10. Poisson Processes – Decomposition and Superposition
We now turn to the first part of the same document.
Read the section on the decomposition property. Pay attention to how the rate of a subprocess is calculated (\lambda_i = \gamma \lambda). Then, work through Example 2 and Example 3 to solidify your understanding of how to apply it.
A More Sophisticated Model of Attack
Our analysis points to the website as the source of the anomaly. This suggests a more sophisticated model. Instead of thinking of the process as a single stream that was unnaturally "swollen," it's more accurate to model the observed traffic as the sum of two distinct processes: the normal background traffic and a separate, malicious event traffic.
This is a concept used in advanced event detection. In our case, for the website channel:
- is 13 bookings.
- is what we'd expect in an hour, which is .
- This implies an anomalous "event" process contributed bookings.
This framework, where an observed time series is treated as an additive combination of a normal, periodic process and a rare, bursty event process, is a powerful tool for anomaly detection. The following research paper explores this idea in depth. While the implementation details are highly technical, the conceptual model is directly relevant to our case.
Adaptive Event Detection with Time–Varying Poisson Processes
This paper from KDD, a top data mining conference, describes a probabilistic model for finding unusual events in count data, like traffic on a freeway or, in our case, bookings on a website.
First, read the introduction and Section 5, up to the sentence that introduces the core modeling assumption: N(t) = N0(t) + NE(t). This frames the problem exactly as we have. Next, read Section 5.2, Modeling Rare, Persistent Events. This section describes how the anomalous part of the signal, N_E(t), can be modeled as its own Poisson process that is "switched on" only during an event. This perfectly describes a scenario like a bot attack that runs for a limited time. You need not concern yourself with the details of the Markov process or Bayesian inference, but focus on the conceptual structure of the model.
This model confirms our conclusion: the booking data from the website is best explained not by a random fluctuation, but by the addition of an entirely separate, malicious process with a very high rate, layered on top of the normal background noise. We have isolated the point of attack.
Conclusion
By dissecting the incoming stream of bookings, we have moved from knowing that something was wrong to knowing how and where. The evidence is no longer just a suspicious total, but a distorted pattern that points to a specific channel.
Your key takeaways for the case file:
- Superposition: Independent Poisson streams can be merged by summing their rates. This allowed us to confirm the studio's overall normal rate of 5 bookings/hour.
- Decomposition: A single Poisson stream can be split into subprocesses. This allowed us to calculate the expected distribution of bookings across channels.
- The Critical Clue: The observed distribution of bookings (1 phone, 13 website, 1 app) was vastly different from the expected distribution (3 phone, 6 website, 6 app), even for a high-volume hour.
- The Verdict: The evidence overwhelmingly suggests a targeted attack focused on the website's booking portal. The data is consistent with a malicious, high-rate process being temporarily added to the normal flow of web traffic.
Preview of the Next Lesson
We have pinpointed the method of attack. But our duty as analysts extends beyond the studio's operational integrity to the consequences for its clients. After all, what is the point of a relationship consultancy if the relationships themselves don't last?
In our next session, we will pivot from the arrival of clients to the duration of their relationships. We will introduce the tools of survival analysis, calculating survival and hazard functions to investigate whether there is a pattern to when relationships formed via the studio begin to fail. This will open up a new line of inquiry into the long-term effectiveness of Aphrodite's Veil.