Hello! Welcome back to our course module on Advanced Excel.
In our last lesson, we mastered the INDEX and MATCH functions. You learned how to create flexible and robust formulas to look up specific pieces of information, even when VLOOKUP fails. While lookup formulas are excellent for pulling individual records, a data analyst often needs to answer bigger questions about the entire dataset, such as "What are the total sales per region?" or "How many customers did we have each month?". Answering these questions manually with formulas would be incredibly time-consuming.
This is where Pivot Tables come in. They are one of Excel's most powerful features for data analysis. In this lesson, you will learn how to use them to instantly summarize, group, and analyze large amounts of data with just a few clicks. This is a foundational skill that allows you to quickly explore a new dataset and generate insightful reports.
Today's learning outcome: By the end of this 60-minute lesson, you will be able to build pivot tables to summarize and aggregate data by categories.
What is a Pivot Table and Why Is It So Useful?
Think of your raw data as a large collection of individual transactions or records. A pivot table is a tool that transforms this raw data into an organized summary. It lets you "pivot" your data, meaning you can rearrange it to view it from different angles, revealing patterns and insights that are hidden in the raw format.
To understand the core purpose of pivot tables, it's helpful to distinguish between two types of data in your dataset:
- Categories (or Dimensions): These are descriptive, non-numeric fields that you can use to group your data. Examples include
Region,Product Category,Salesperson, orDate. - Facts (or Measures): These are the numeric values you want to analyze or calculate. Examples include
Sales Amount,Quantity, orCustomer Count.
A pivot table works by summarizing your Facts according to your chosen Categories.
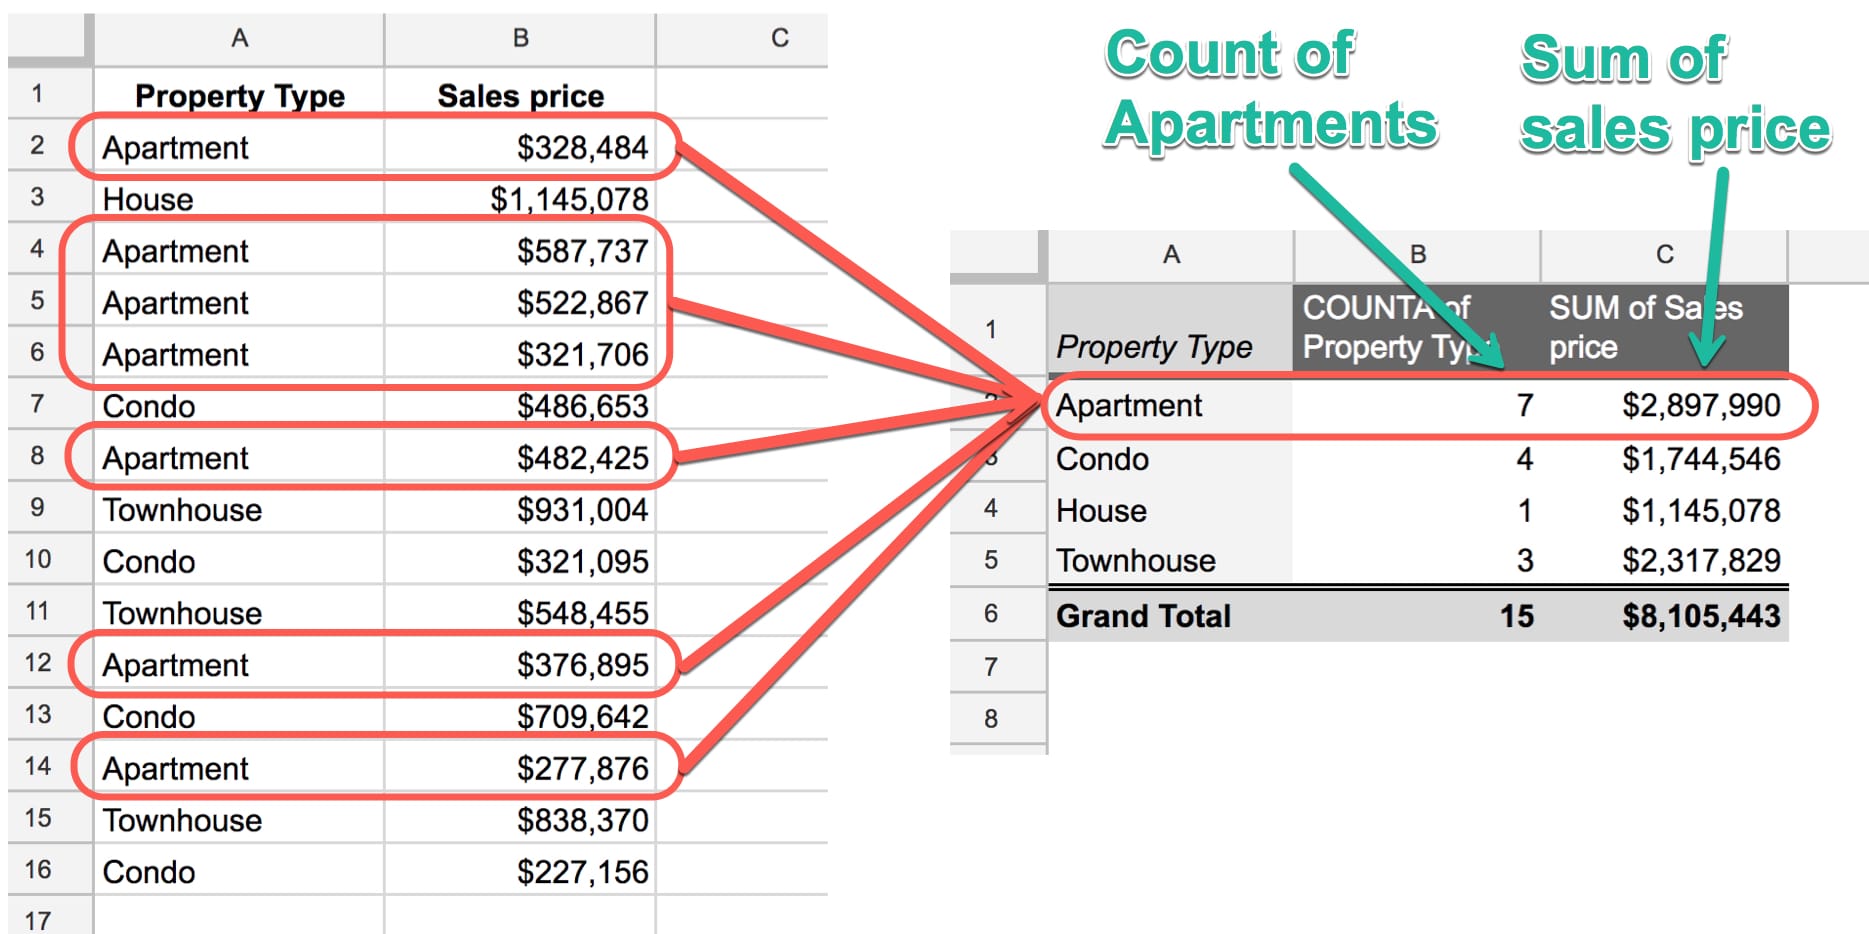
The image below shows this transformation perfectly. On the left is raw sales data, and on the right is a pivot table that aggregates that data, counting the number of properties and summing the sales price for each Property Type.
To get a deeper understanding of why this is so valuable for business reporting, please read the first few sections of the following article.
Pivot Tables in Excel: From Beginner Basics to Advanced Insights
This article from OfficePro Consulting clearly explains the purpose and power of pivot tables in a business context.
Read the sections titled 'What Are Pivot Tables in Excel and How Do They Work?' and 'Why Pivot Tables in Excel Are Essential for Summarising and Analysing Data'. This will give you a solid theoretical foundation before we start building one.
Preparing Your Data: The Most Important Step
Before creating a pivot table, your data must be properly structured. Garbage in, garbage out! Following a few simple rules will prevent most common pivot table problems.
- Tabular Format: Your data should be in a simple table format, with each column having a unique header in the first row and each row representing a single record.
- No Blank Rows or Columns: Ensure there are no completely empty rows or columns within your data.
- Use an Excel Table: This is a crucial best practice. By formatting your data as an official Excel Table (
Ctrl+T), your pivot table's data source becomes dynamic. When you add new rows of data to your table, you only need to "refresh" the pivot table to include them, without manually changing the source range.
The following video provides an excellent summary of these data preparation steps.
How to Create Pivot Table in Excel
In this video, Kevin Stratvert explains why pivot tables are superior to manual formula-based summaries and walks through the critical data preparation steps.
Watch from 01:52 to 03:43. Pay close attention to the three rules for prepping data: descriptive headers, no empty rows/columns, and converting your data into an official Excel Table.
Building a Pivot Table: A Step-by-Step Guide
Once your data is prepared, you can create a pivot table. The process involves dragging and dropping your data fields into four specific areas.
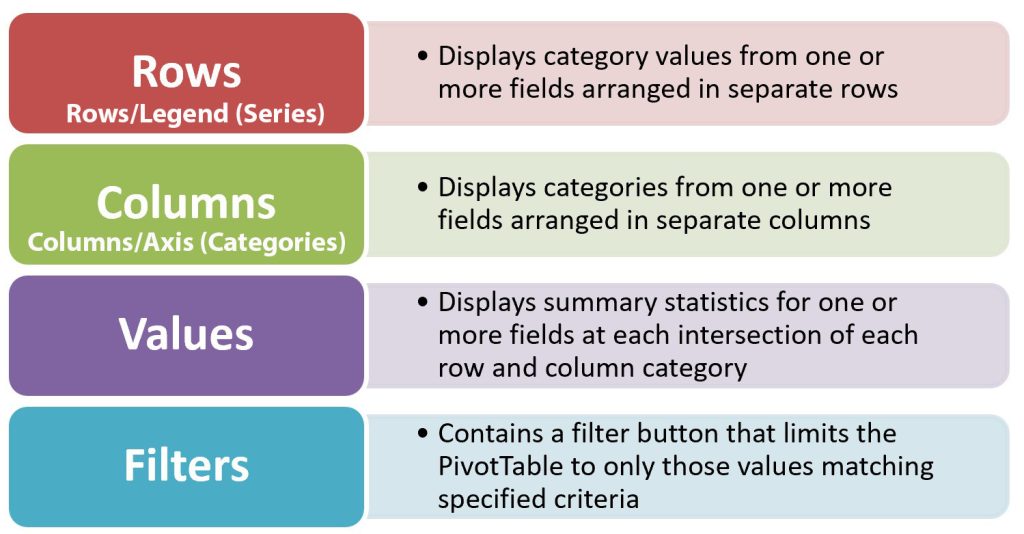
This diagram clearly explains the function of each area in the "PivotTable Fields" pane:
Following our "Categories vs. Facts" model:
- Rows & Columns: Drag your Category fields here.
- Values: Drag your Fact fields here. Excel will perform a calculation (like
SUMorCOUNT). - Filters: Drag a Category field here to apply a filter to the entire table.
Now, let's watch how this is done in practice.
How to Create Pivot Table in Excel
This segment of the video will walk you through creating your first pivot table. You'll see how to drag fields into the different areas to build a summary report.
Watch from 03:43 to 07:56. Observe how 'Customer' (a category) is dragged to 'Rows' and 'Revenue' (a fact) is dragged to 'Values'. Also, notice how the aggregation for 'Order ID' is changed from the default SUM to COUNT to get a meaningful result.
Exploring Your Data: Pivoting and Aggregating
The true power of a pivot table lies in its flexibility. You can quickly rearrange, or "pivot," the fields to explore different questions.
Let's see a few examples of how you can manipulate the pivot table to gain different insights.
Learn Excel Pivot Tables in 10 Minutes - A complete beginner's tutorial
This next video from Chandoo offers a very quick and clear demonstration of how to modify a pivot table to answer different questions.
Watch the following three short clips: Multi-level Grouping (03:32 - 04:29): See how adding a second category ('Geography') to the Rows area creates a hierarchical report. Notice how moving it to the Columns area completely changes the layout. Filtering (04:29 - 05:00): Watch how the Filters area is used to view the data for just one specific geography. Changing the Summary Calculation (08:22 - 09:16): See how you can add the 'Amount' field a second time and change its calculation to show 'Percentage of Column Total', providing a different kind of summary.
These techniques—grouping by multiple categories, changing layouts, filtering, and altering summary calculations—are the core activities of exploratory data analysis in Excel.
Practice Exercise
Now it's your turn to build a pivot table. Imagine you have the following sales data in an Excel sheet:
| Date | Region | Product | Units Sold | Sales Amount |
|---|---|---|---|---|
| 01-Jan | North | Alpha | 10 | $500 |
| 01-Jan | South | Beta | 5 | $300 |
| 02-Jan | North | Beta | 8 | $480 |
| 02-Jan | West | Alpha | 12 | $600 |
| 03-Jan | South | Alpha | 7 | $350 |
| 03-Jan | North | Gamma | 15 | $900 |
| 04-Jan | West | Beta | 9 | $540 |
Your Task:
Create a pivot table that answers the question: "What were the total sales for each product in each region?"
Steps:
- Enter the data into a new Excel sheet.
- Format the data as an Excel Table (
Ctrl+T). - Insert a PivotTable on a new worksheet.
- Drag the appropriate fields to the Rows, Columns, and Values areas to construct your report.
- Hint:
RegionandProductare your categories.Sales Amountis your fact.
- Hint:
Conclusion
You have now learned how to use one of the most efficient tools for data analysis in Excel. Instead of writing complex formulas, you can now summarize thousands of rows of data in seconds.
Key Takeaways:
- Pivot tables are used to summarize and aggregate large datasets by grouping data based on categories and calculating summary statistics for facts.
- Proper data preparation is essential: use a clean, tabular format and always convert your data range into an Excel Table (
Ctrl+T). - You build a pivot table by dragging fields into four areas: Rows, Columns, Values, and Filters.
- You can easily change the summary calculation from
SUMtoCOUNT,AVERAGE, and more, or show values as percentages.
Mastering pivot tables will dramatically speed up your ability to explore and understand new datasets.
In our next lesson, we will learn about conditional functions like COUNTIF, SUMIF, and AVERAGEIF. These functions allow you to perform calculations on a subset of your data based on specific criteria, giving you a formula-based alternative for simple summaries when a full pivot table isn't necessary.