Hello! Welcome back.
In our last lesson, we laid the groundwork by distinguishing between discrete and continuous random variables and their corresponding probability functions (PMF and PDF). This allowed us to describe the likelihood of various outcomes in a random experiment.
Today, we will build directly on that foundation to learn how to summarize these entire probability distributions using just two powerful numbers. The learning outcome for this lesson is to calculate and interpret the expected value and variance of random variables. By the end of our session, you'll be able to:
- Define and calculate the expected value (), which describes the "center" or long-run average of a random variable.
- Define and calculate the variance () and standard deviation (), which describe the "spread" or variability of a random variable.
- Apply these concepts to both discrete and continuous random variables.
These are core concepts in statistics and machine learning, and they are essential for your GATE exam preparation. Let's begin.
1. Expected Value: The Center of a Distribution
The expected value of a random variable is its theoretical mean. Imagine repeating an experiment an infinite number of times and averaging the outcomes; that average would be the expected value. It's the "center of mass" of the probability distribution. We denote it as or by the Greek letter (mu).
Expected Value of a Discrete Random Variable
For a discrete random variable, the expected value is a weighted average of all possible values, where each value is weighted by its probability.
The formula is:
Here, you take each possible value , multiply it by the probability of that value occurring, and sum up all these products.
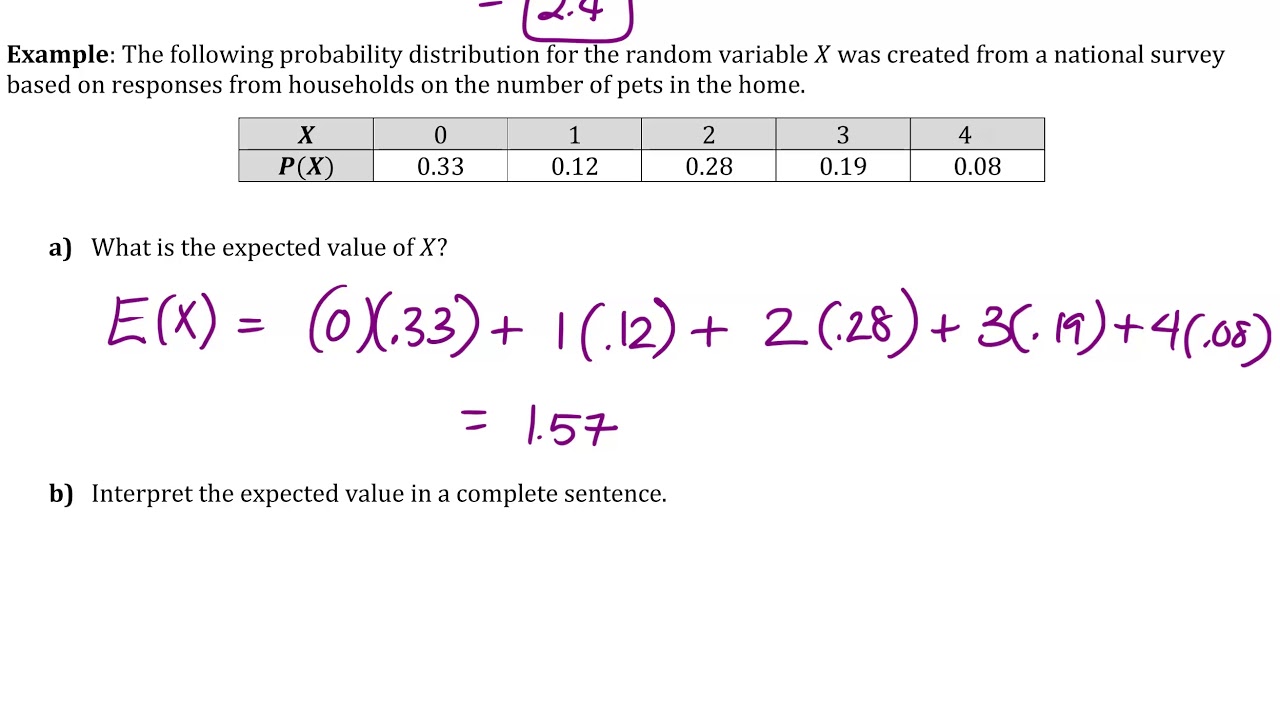
To see a detailed walkthrough of this concept, let's watch the first part of a helpful video.
The Expected Value and Variance of Discrete Random Variables
The video 'The Expected Value and Variance of Discrete Random Variables' from the jbstatistics channel provides a clear definition of expected value and works through a practical example.
Please watch the following segments: 00:43 - 02:24: This section defines expected value and introduces the formula for discrete variables. 04:27 - 06:24: This section provides a step-by-step calculation for the expected number of heads in a coin toss experiment.
An important point from the video is that the expected value might not be a value that the random variable can actually take. For instance, in the image example, , but you can't own 1.57 pets. It's the long-term average.
Expected Value of a Continuous Random Variable
For continuous random variables, the logic is the same, but we replace the summation with an integral. Since probability is the area under the PDF curve, we integrate the product of the value and the probability density over the entire range of possible values.
The formula is:

Let's watch a video that brilliantly visualizes how the discrete sum naturally becomes an integral as we move to continuous variables.
Expected Values for Continuous Variables!!!
The video 'Expected Values for Continuous Variables!!!' from StatQuest with Josh Starmer gives an excellent intuition for why we use an integral for continuous variables.
Watch from 07:00 to 12:31. Focus on how approximating a continuous distribution with many small rectangles (a discrete approach) leads directly to the concept of an integral for finding the exact expected value. You don't need to follow the complex integration by parts derivation that follows; the conceptual leap is the key takeaway here.
To see this formula in action, let's look at a text resource that works through some standard examples.
Expectation, Variance and Standard Deviation for Continuous Random Variables
This document from MIT OpenCourseWare formally defines the expected value for continuous variables and calculates it for important distributions like the Uniform and Exponential.
Read 'Section 3: Expected value of a continuous random variable' and its subsections (3.1, 3.2, 3.3). Focus on the definition and the results of the examples (e.g., for a uniform distribution on [0,1], the mean is 0.5). You can skim the detailed integration steps if you wish.
Test your understanding!
Let be a discrete random variable representing the outcome of a single roll of a fair six-sided die. The PMF is for . What is the expected value of ?
Show answer
We use the formula .
As expected, the average value is 3.5, which is exactly in the middle of the possible outcomes, even though you can never roll a 3.5.
2. Variance and Standard Deviation: The Spread of a Distribution
While expected value tells us about the center of a distribution, it doesn't tell us how spread out the values are. For that, we use variance and standard deviation.
Variance, denoted or , is the expected value of the squared difference from the mean. A small variance means the data points tend to be very close to the mean; a large variance means they are spread out.
Standard Deviation, denoted , is simply the square root of the variance. Its advantage is that it is in the same units as the random variable, making it more interpretable.
Variance of a Discrete Random Variable
There are two common formulas for variance:
- The Definitional Formula: This is good for interpretation.
- The Computational Formula: This is usually easier for calculations.
To use this, you first calculate , and then subtract the square of the mean () which you already calculated.
Let's see how both of these formulas are used in practice.
The Expected Value and Variance of Discrete Random Variables
We'll return to the jbstatistics video, which now explains the concept of variance and demonstrates calculations using both the definitional and computational formulas.
Please watch the following segments: 02:50 - 04:27: This part introduces the two formulas for variance. 08:10 - 11:10: This part shows a full calculation using both formulas, demonstrating that they give the same result and highlighting why the computational formula is often easier.
Variance of a Continuous Random Variable
The formulas for continuous variables are analogous, with integrals replacing sums:
- The Definitional Formula:
- The Computational Formula:
The following resource formally defines these and provides key examples.
Expectation, Variance and Standard Deviation for Continuous Random Variables
The same MIT document also details the calculation of variance for continuous random variables.
Read 'Section 4: Variance' and its subsection (4.1). Again, focus on the definitions and the final results for the examples (e.g., Var(X) for the uniform and exponential distributions).
Test your understanding!
Let's continue with the fair six-sided die roll, where . Calculate the variance of . Use the computational formula: .
Step 1: Calculate .
Step 2: Use the result to find .
Show answer
Step 1: Calculate
We use the formula .
Step 2: Calculate
Now we use .
So, the variance is approximately 2.917. The standard deviation would be .
3. Properties and Shortcuts
For the GATE exam, knowing some key properties and standard formulas will save you a lot of time.
Properties of Expectation and Variance
Let be a random variable and be constants.
-
- Interpretation: If you scale a variable by and shift it by , the mean is also scaled and shifted.
-
- Interpretation: Shifting a distribution () doesn't change its spread. Scaling it by multiplies the variance by (and the standard deviation by ).
Formulas for Common Distributions
For many standard distributions you will encounter, the expected value and variance are given by simple formulas. Memorizing these is crucial for efficiency.
Lesson 1: Discrete random variables, probability functions ...
This document from the University of Waterloo provides a concise summary of the properties of expectation and variance. It also includes a table with the standard formulas for common distributions you'll need to know.
First, read the section 'Properties of Expectation and Variance' to understand the rules for E(aX+b) and Var(aX+b). Then, study the 'Summary Table' at the end. Focus on the 'Expectation' and 'Variance' columns for the Bernoulli, Binomial, Geometric, and Poisson distributions. These are high-yield formulas for exams.
Conclusion
Great work! You've now learned how to distill a potentially complex probability distribution into two simple, meaningful numbers: its center and its spread.
Key Takeaways:
- Expected Value () is the long-run average or "center of mass" of a random variable.
- Discrete:
- Continuous:
- Variance () measures the expected squared deviation from the mean, quantifying the "spread" of the distribution.
- The computational formula is often easiest: .
- Standard Deviation () is the square root of the variance and has the same units as the random variable, making it easy to interpret.
- Knowing the properties of and , along with the standard formulas for common distributions, is a critical skill for problem-solving.
Preview of the Next Lesson:
In this lesson, we saw a table of formulas for common distributions. In our next session, we'll dive deep into some of these, starting with discrete distributions. We will model scenarios using the Bernoulli, Binomial, and Poisson distributions, learning when to use each one and how to solve problems with them.