Hello! Welcome to your next lesson in the "Model Evaluation and Improvement" module.
In our last lesson, we explored the Central Limit Theorem (CLT), which tells us that the means of samples form a normal distribution around the true population mean. This is a powerful idea because it allows us to use a single sample to make an educated guess about an entire population.
Today, we will put that idea into practice. We'll learn how to conduct formal statistical tests to answer questions like: "Is the average performance of my model truly better than a baseline?" or "Is there a significant difference in outcomes between two user groups in an A/B test?"
This lesson directly addresses the learning outcome: Formulate hypotheses and perform one-sample and two-sample t-tests. We will build a foundational understanding of hypothesis testing, which is a core skill for any data scientist.
1. The Language of Hypothesis Testing
Before we perform any test, we need to learn the language used to frame the question. Hypothesis testing is like a formal debate. We have two opposing statements, and we use data to decide which one is more credible.
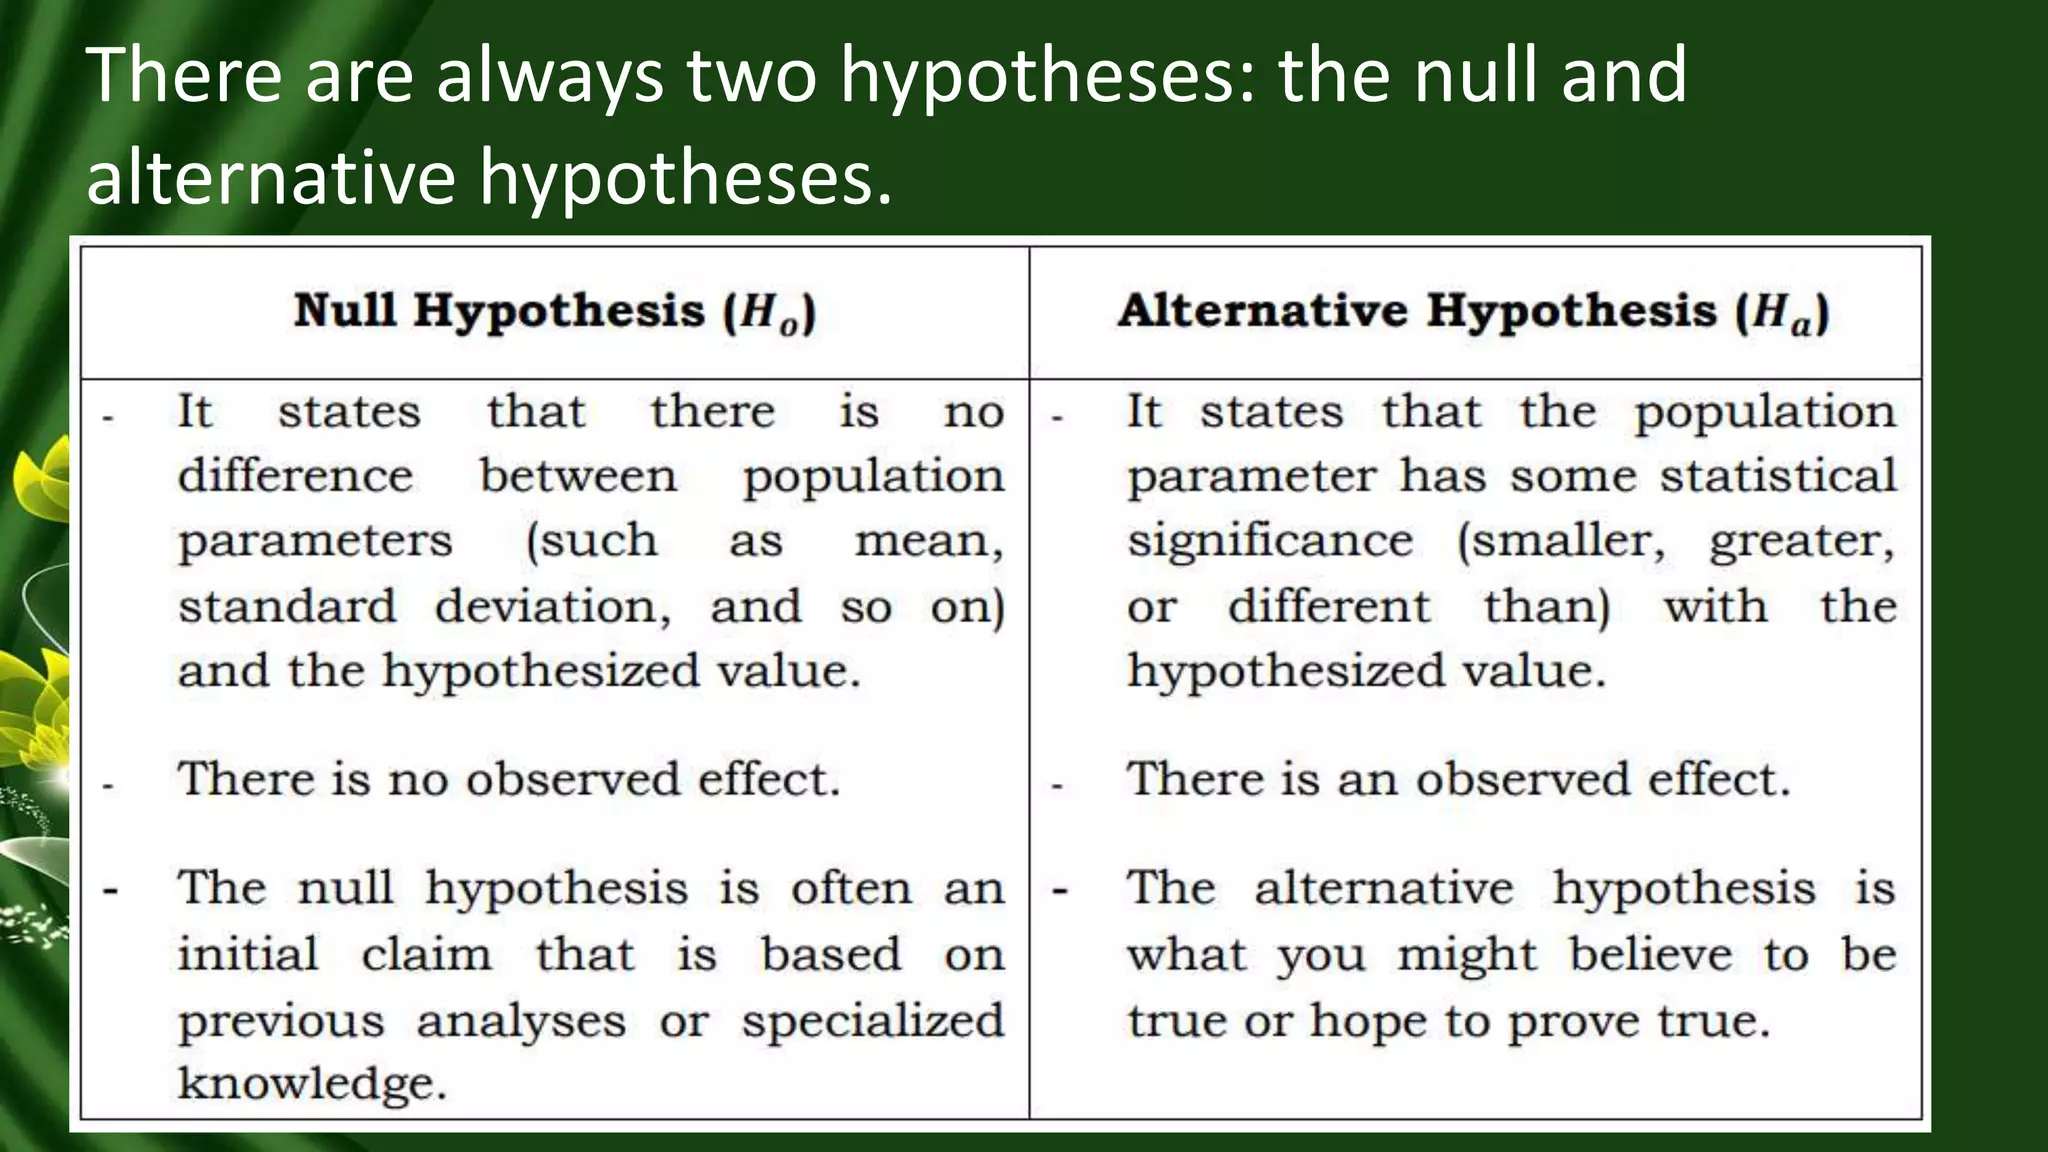
These two statements are the Null Hypothesis () and the Alternative Hypothesis ().
-
Null Hypothesis (): This is the default assumption, the "status quo." It proposes that there is no effect, no difference, or no relationship. For example, "This new drug has no effect on blood pressure," or "The mean score of my students is equal to the national average." We assume is true until we have strong evidence against it.
-
Alternative Hypothesis ( or ): This is the claim we want to test. It proposes that there is an effect, a difference, or a relationship. For example, "This new drug does lower blood pressure," or "The mean score of my students is different from the national average."
Our goal in hypothesis testing is not to prove the alternative hypothesis is true. Instead, our goal is to see if we can gather enough evidence to reject the null hypothesis.
How do we decide? We calculate a p-value.
- The p-value is the probability of observing our data (or something more extreme) if the null hypothesis were true.
- A small p-value (typically < 0.05) means our observation is very unlikely under the null hypothesis. This gives us evidence to reject in favor of .
- The threshold for this decision is the significance level, denoted by alpha (). A common choice for is 0.05.
Decision Rule: If p-value < , we reject .
2. Introduction to the t-Test
In the last lesson, we used the Z-score when the population standard deviation () was known. In the real world, we almost never know . This is where the t-test comes in.
A t-test is used to compare the means of one or two groups when the population standard deviation is unknown. Instead, we use the sample standard deviation () to estimate it. This introduces a bit more uncertainty, which the t-test is designed to handle.
There are three main types of t-tests. The following video provides an excellent overview of each one.
t-Test - Full Course - Everything you need to know
Let's watch the beginning of the video 't-Test - Full Course - Everything you need to know' by numiqo to understand the different scenarios where t-tests are used.
Watch from the beginning to 06:28. Focus on understanding the three types of t-tests (one-sample, independent, paired) and the null/alternative hypotheses for each.
As the video explained, the main types are:
- One-Sample t-Test: Compares the mean of a single sample to a known value (e.g., "Is our class average of 75 significantly different from the school's claimed average of 70?").
- Independent Samples t-Test: Compares the means of two independent groups (e.g., "Do students who received tutoring (Group A) have different test scores than students who did not (Group B)?").
- Paired Samples t-Test: Compares the means of the same group at two different times or under two different conditions (e.g., "Did the same group of students score higher on a test after a training program compared to before?").
Today, we'll focus on the first two, which are fundamental for the GATE exam.
3. The One-Sample t-Test
Let's dive into the one-sample t-test. We use it to test if the mean of a population, from which our sample is drawn, is equal to some hypothesized value .
-
Hypotheses:
- : (The true population mean is equal to the hypothesized value).
- : (The true population mean is not equal to the hypothesized value). This is a two-tailed test.
-
t-statistic formula:
Where:- is the sample mean.
- is the hypothesized population mean.
- is the sample standard deviation.
- is the sample size.
- The term is the standard error of the mean (SEM), our estimate for the standard deviation of the sampling distribution.
Notice how this formula is almost identical to the Z-score from our last lesson. We've just replaced the population standard deviation with the sample standard deviation .
Performing the Test in Python
Theory is great, but let's see how it's done in practice. We'll use the pingouin library in Python, which gives clear and comprehensive results.
The following reading will walk you through an example of a one-sample t-test, from the theory to the Python code.
Comparing Two Means — The one-sample t-test
Please read this section from 'Learning Statistics with Python'. It introduces the one-sample t-test, explains why it's needed, and shows how to perform it using both scipy and the more user-friendly pingouin library.
Read the subsections 'Introducing the t-test' and 'Doing the test in Python'. Focus on the pingouin example and how to interpret the output table. Don't worry about the scipy code for now; pingouin is more straightforward.
As you saw in the reading, running the test in pingouin is simple:ttest(data, popmean)
The output table gives us everything we need:
T: The calculated t-statistic.dof: The degrees of freedom (), which represents the number of independent pieces of information.p-val: The p-value.CI95%: The 95% confidence interval for the mean.cohen-d: A measure of effect size (how large the difference is).
If the p-val is less than our significance level (e.g., 0.05), we reject the null hypothesis and conclude that our sample mean is significantly different from the hypothesized value.
Test your understanding!
A machine is supposed to fill bags with 500g of coffee. You take a sample of 25 bags and find the mean weight is 495g with a sample standard deviation of 10g. You want to test if the machine is working correctly.
- What are your null and alternative hypotheses?
- If you ran a one-sample t-test and got a p-value of 0.015, what would you conclude at a significance level of ?
Show answer
-
Hypotheses:
- : (The true average weight of bags is 500g).
- : (The true average weight is not 500g).
-
Conclusion:
Since the p-value (0.015) is less than the significance level (0.05), you would reject the null hypothesis. You have statistically significant evidence to conclude that the machine is not filling the bags to 500g on average.
4. The Two-Sample t-Test
This is one of the most common statistical tests. It's used to determine if the means of two independent groups are significantly different from each other. Think of it as the engine behind A/B testing.
- Hypotheses:
- : (The means of the two populations are equal).
- : (The means of the two populations are different).
There are two versions of this test:
- Student's t-test: Assumes that both groups have the same variance.
- Welch's t-test: Does not assume equal variances. This test is more robust and is the default in most modern software, including
pingouin. It's generally the safer choice.
Performing the Test in Python
Let's see how to compare two groups using Python.
Comparing Two Means — The independent samples t-test
Now, let's continue with the same resource, 'Learning Statistics with Python', to learn about the independent samples t-test. This section covers both the Student's and Welch's versions and shows how to implement them.
Read the sections titled 'The independent samples t-test (Student test)' and 'The independent samples t-test (Welch test)'. Pay attention to the difference in assumptions (homogeneity of variance) and how to run both tests in pingouin.
To run an independent two-sample t-test in pingouin, you provide the data for the two groups as separate inputs:ttest(group1_data, group2_data)
By default, this performs a Welch's t-test. If you are certain the variances are equal, you can run a Student's test with correction=False. In practice, Welch's test is almost always the better choice.
The interpretation of the output is the same as before: check if the p-val is less than your significance level . If it is, you can reject the null hypothesis and conclude that there is a significant difference between the means of the two groups.
A Note on One-Tailed vs. Two-Tailed Tests
So far, we have only discussed two-tailed tests, where the alternative hypothesis is that the means are simply not equal ( or ).
Sometimes, you might have a directional hypothesis, like "the new drug lowers blood pressure." This requires a one-tailed test:
- (a left-tailed test)
- (a right-tailed test)
In pingouin, you can specify this using the alternative argument: alternative='less' or alternative='greater'. A one-tailed test is more powerful at detecting an effect in a specific direction, but it cannot detect an effect in the opposite direction. Unless you have a strong theoretical reason, a two-tailed test is the standard and safer approach.
Conclusion
Congratulations! You've just learned the fundamentals of one of the most widely used statistical tools. Hypothesis testing allows us to move beyond simply describing our data to making formal, evidence-based decisions.
Key Takeaways:
- Hypothesis testing involves a null hypothesis () (no effect) and an alternative hypothesis () (an effect exists).
- We use the p-value to decide whether to reject . If p-value < (e.g., 0.05), we reject .
- t-tests are used to compare means when the population standard deviation is unknown.
- A one-sample t-test compares a single sample mean to a known value.
- An independent two-sample t-test compares the means of two separate groups. Welch's t-test is generally preferred as it doesn't assume equal variances.
Preview of the Next Lesson:
In the output tables from pingouin, you saw a CI95% column. This represents the 95% confidence interval. While a t-test gives a yes/no answer about a significant difference, a confidence interval gives us a range of plausible values for the true population mean (or the difference in means). In our next lesson, we will focus on how to construct and interpret confidence intervals, providing another powerful way to understand our model's performance and the uncertainty around it.