Hello! Welcome to the final lesson in our "Model Evaluation and Improvement" module.
In our last lesson, we learned how to use t-tests to get a definitive "yes" or "no" answer to questions about our data—for example, whether the mean performance of a model is significantly different from a baseline. This is incredibly useful, but it doesn't tell the whole story.
Today, we'll explore a concept that gives us a much richer understanding: confidence intervals. While a hypothesis test tells you if an effect is statistically significant, a confidence interval tells you the magnitude of that effect by providing a range of plausible values for the true population mean. This is a more informative way to quantify uncertainty.
This lesson directly addresses our learning outcome: Construct and interpret confidence intervals for population means.
1. From Point Estimates to Interval Estimates
Imagine you have a sample of 25 user ratings for your new app, and the average rating is 4.2 stars. This sample mean () is our point estimate for the true average rating () across all users. It's our single best guess, but it's almost certainly not the exact true mean.
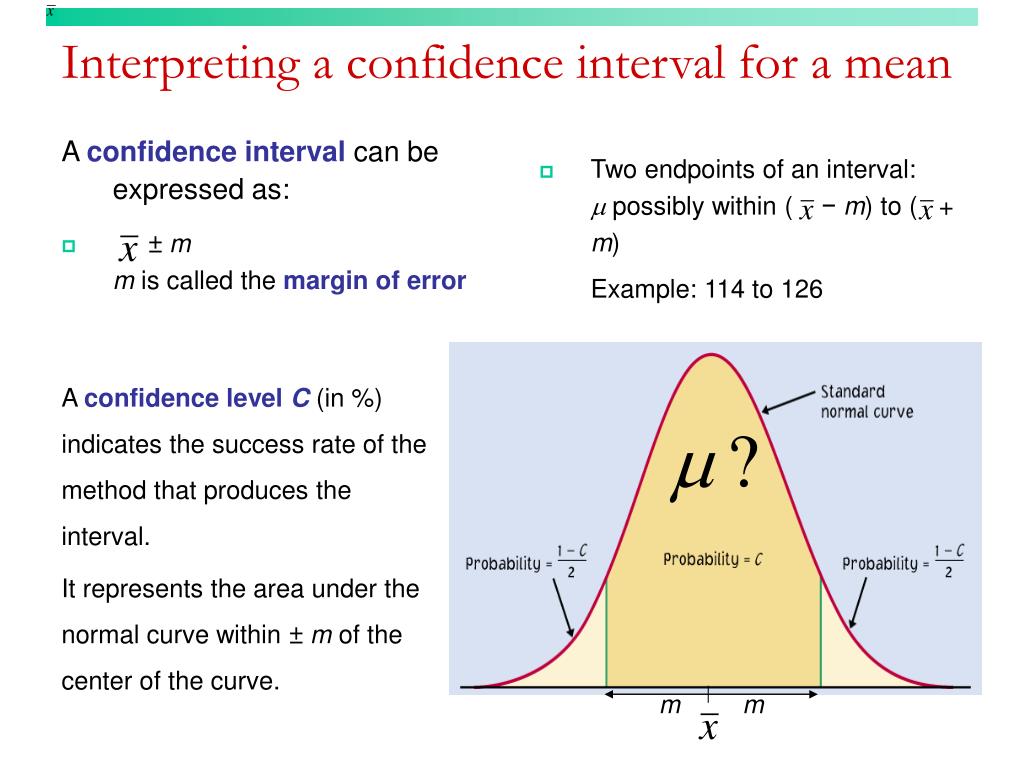
An interval estimate, or confidence interval, is more realistic. Instead of guessing a single value, we provide a range, like "we are 95% confident that the true average rating is between 3.9 and 4.5 stars."
This range is constructed as:
The Meaning of "Confidence"
This is one of the most misunderstood concepts in statistics. What does "95% confident" actually mean?
It does not mean there is a 95% probability that the true population mean is in your calculated interval.
The correct interpretation is a subtle but important one based on the frequentist view of statistics.
Lesson 2: Confidence Intervals for One Mean
To understand this crucial concept correctly, let's read a short section from a statistics textbook by Penn State University.
Read the section titled '2.3 - Interpretation'. It explains why it's incorrect to make probability statements about the population mean and provides the correct, frequentist interpretation of a confidence interval.
In summary, the population mean is a fixed, unknown constant. It doesn't move. The confidence interval, however, is calculated from a random sample, so it's the interval that is random. A 95% confidence level means that if we were to repeat our sampling process 100 times and create 100 different confidence intervals, we would expect about 95 of those intervals to successfully "capture" the true population mean.
2. How to Construct a Confidence Interval
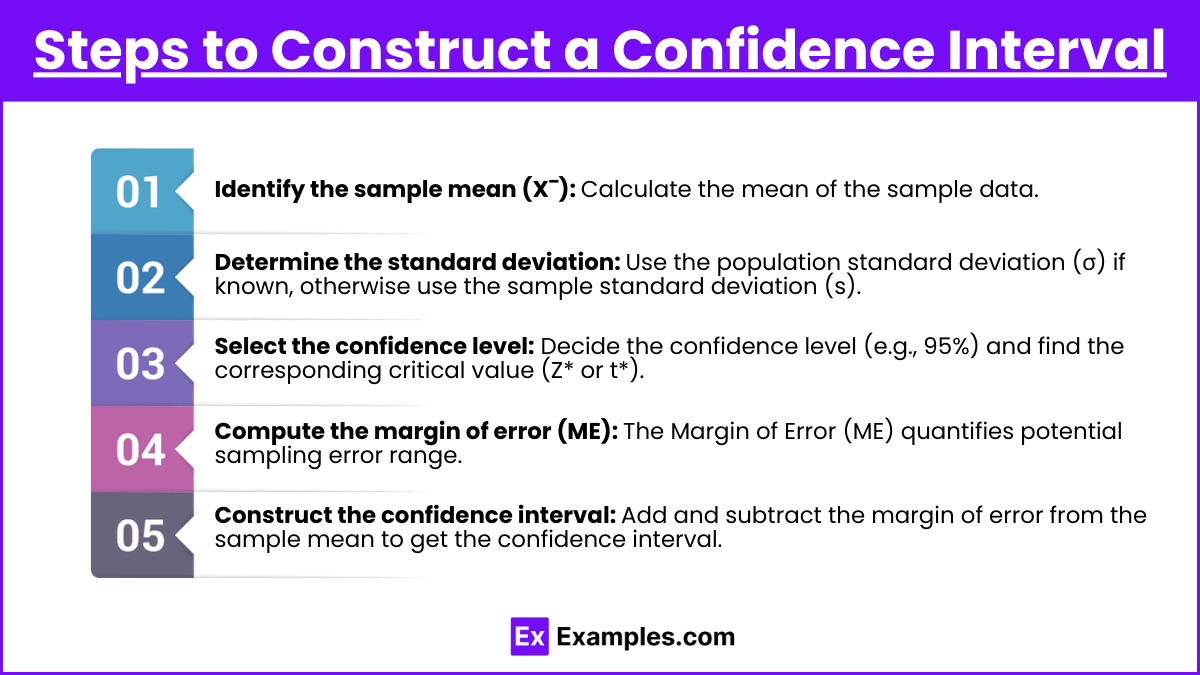
The process of building a confidence interval involves a few key steps. The formula we use depends on whether or not we know the population standard deviation, .
Scenario 1: Population Standard Deviation () is Known (The Z-Interval)
This scenario is rare in the real world (if you don't know the population mean, you're unlikely to know its standard deviation), but it's a great starting point for understanding the mechanics. When is known, we use the Z-distribution (the standard normal distribution).
The formula for a confidence interval is:
Where:
- is the sample mean.
- is the known population standard deviation.
- is the sample size.
- is the critical Z-value corresponding to our desired confidence level. For a 95% confidence interval, , and is 1.96. This value cuts off the top 2.5% of the standard normal distribution.
To see this calculation in action, let's watch a clear, step-by-step example.
How To Find The Z Score, Confidence Interval, and Margin of Error for a Population Mean
This video from The Organic Chemistry Tutor demonstrates how to calculate a 95% confidence interval when the population standard deviation is known.
Watch the first example in the video, from 00:23 to 07:29. Pay close attention to how the Z-score (1.96), standard error, and margin of error are calculated and combined to form the final interval.
Scenario 2: Population Standard Deviation () is Unknown (The t-Interval)
This is the far more common and practical scenario. When is unknown, we estimate it using the sample standard deviation ().
Using an estimate introduces more uncertainty. To account for this, we don't use the Z-distribution. Instead, we use the t-distribution, which you'll remember from our last lesson on t-tests. The t-distribution is similar to the normal distribution but has "fatter" tails, reflecting the increased uncertainty. Its shape depends on the degrees of freedom ().
The formula for the t-interval is:
Notice the only changes are using the sample standard deviation and the critical t-value () instead of the Z-value.
This next video explains why we use the t-distribution and how to construct the interval.
Confidence Interval for a population mean - t distribution
Now, let's watch this video by Joshua Emmanuel, which explains how to construct a confidence interval using the t-distribution when sigma is unknown.
Watch from the beginning to 05:23. Focus on why the t-distribution is necessary, how to find the critical t-value using degrees of freedom, and how to calculate the margin of error and the final interval.
Test your understanding!
You want to estimate the average time users spend on your website's new feature. You sample 16 users and find their average time is 8.5 minutes, with a sample standard deviation of 2 minutes. Construct a 95% confidence interval for the true mean time.
(Hint: For a 95% CI with , the critical t-value is .)
Show answer
-
Identify the components:
- Sample mean
- Sample standard deviation
- Sample size
- Degrees of freedom
- Critical t-value
-
Calculate the Standard Error of the Mean (SEM):
-
Calculate the Margin of Error (ME):
-
Construct the Confidence Interval:
The interval is [7.43, 9.57].
We are 95% confident that the true average time users spend on the feature is between 7.43 and 9.57 minutes.
3. Interpreting the Width of a Confidence Interval
The width of a confidence interval gives you a sense of the precision of your estimate.
- A narrow interval (e.g., [8.4, 8.6]) implies a precise estimate.
- A wide interval (e.g., [6.5, 10.5]) implies a lot of uncertainty.
Three factors influence the width of an interval:
- Confidence Level: A higher confidence level (e.g., 99% vs. 95%) requires a wider interval. To be more confident that you've captured the true mean, you need a larger "net."
- Sample Size (): A larger sample size leads to a narrower interval. More data reduces uncertainty, making your estimate more precise. This is the most direct way you can control the precision of your estimate.
- Data Variability (): Data that is more spread out (a larger standard deviation) will produce a wider interval.
4. Confidence Intervals and Hypothesis Testing: Two Sides of the Same Coin
Confidence intervals and hypothesis tests are closely related. A confidence interval can be used to perform a two-tailed hypothesis test at the significance level.
Here's the rule:
- If the value from the null hypothesis () falls outside the confidence interval, you reject the null hypothesis.
- If the value from the null hypothesis () falls inside the confidence interval, you fail to reject the null hypothesis.
Example: In our coffee bag problem from the last lesson, the null hypothesis was . Suppose we calculate a 95% confidence interval and find it to be [490g, 498g]. Since 500g is outside this interval, we would reject the null hypothesis at the level. This tells us not only that the machine is likely malfunctioning, but also gives us a plausible range for its actual average fill weight.
Conclusion
You have now completed the "Model Evaluation and Improvement" module! You've learned about bias and variance, regularization, cross-validation, hypothesis testing, and now, confidence intervals. These are essential tools for any data scientist to rigorously evaluate and understand their work.
Key Takeaways from this Lesson:
- A confidence interval provides a range of plausible values for an unknown population mean, structured as a
point estimate ± margin of error. - The confidence level (e.g., 95%) refers to the long-run success rate of the method, not a probability about a single interval.
- When the population standard deviation () is unknown, we use the t-distribution and the sample standard deviation () to construct the interval.
- The width of an interval indicates the precision of our estimate and is affected by confidence level, sample size, and data variability.
- Confidence intervals can be used to make the same conclusions as a two-tailed hypothesis test, while also providing information about the magnitude of the effect.
Preview of the Next Module:
We're about to dive into the exciting world of Advanced Machine Learning Models. In our next lesson, we will begin Module 10 by exploring powerful ensemble methods, specifically bagging (which is the basis for Random Forests) and boosting (like Gradient Boosting). These techniques combine multiple simple models to create a single, highly accurate predictive model.