Welcome to the first lesson in our module on Database Systems! In our previous modules, we focused on how to write code and implement algorithms to process data. Now, we're shifting our focus to a fundamental question: how do we structure and store that data effectively in the first place? For Data Science and AI, well-structured data is the essential raw material.
Today's lesson is all about designing the blueprint for a database. Our learning outcome is to design an Entity-Relationship (ER) diagram to model a database schema. An ER diagram is a visual tool that helps us understand and plan the logical structure of a database before we write a single line of SQL.
We will learn to identify the key components of a system and represent them using a standard set of symbols. By the end of this lesson, you'll be able to take a set of requirements and turn them into a clear, logical diagram.
The Core Components of an ER Diagram
An ER diagram is built from three main concepts: Entities, Attributes, and Relationships. Think of them as the nouns, adjectives, and verbs of our database blueprint.
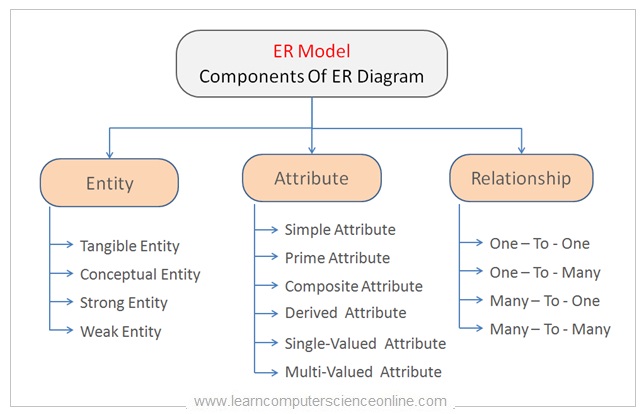
- Entity: A real-world object or concept that we want to store information about. For example, in a university database,
Student,Course, andProfessorwould be entities. An entity is represented by a rectangle. - Attribute: A property or characteristic of an entity. For a
Studententity, attributes might includestudent_id,name, anddate_of_birth. Attributes are represented by ovals. - Relationship: An association between two or more entities. For example, a
Studentenrolls in aCourse. A relationship is represented by a diamond.
To get a solid grasp of these components and their various types, let's dive into a foundational reading.
This article from GeeksforGeeks provides a clear and structured introduction to the fundamental components of an ER model and their standard notations.
Please read the sections on 'Entity' (including 'Types of Entity'), 'Attributes in ER Model' (including 'Types of Attributes'), and 'Relationship Type and Relationship Set' (up to 'Degree of a Relationship Set'). As you read, focus on understanding the definition of each component and its corresponding symbol in an ER diagram.
From the reading, you'll have learned about important distinctions, such as:
- Strong vs. Weak Entities: A strong entity has a primary key (an attribute that uniquely identifies it), while a weak entity depends on a strong entity for its identification.
- Types of Attributes:
- Key: An underlined attribute that uniquely identifies an entity (e.g.,
StudentID). - Composite: An attribute that can be broken down into smaller parts (e.g.,
Addresscan beStreet,City,State). - Multivalued: An attribute that can hold more than one value (e.g.,
PhoneNumber). - Derived: An attribute that can be calculated from another (e.g.,
Agecan be derived fromDateOfBirth).
- Key: An underlined attribute that uniquely identifies an entity (e.g.,
Defining the Rules: Cardinality and Participation
Simply connecting entities isn't enough. We need to define the business rules that govern these connections. This is done using cardinality and participation constraints.
-
Cardinality specifies the maximum number of times an instance of one entity can be related to instances of another entity.
- One-to-One (1:1): A student can have only one student ID card, and that card is assigned to only one student.
- One-to-Many (1:N): One professor can teach many courses, but each course is taught by only one professor.
- Many-to-Many (M:N): A student can enroll in many courses, and a course can have many students.
-
Participation Constraint specifies whether an entity's existence depends on its being related to another entity.
- Total Participation (Double Line): Every entity instance must participate in the relationship. For example, if every course must have a professor assigned, the
Courseentity has total participation in the "teaches" relationship. - Partial Participation (Single Line): An entity instance's participation is optional. For example, a professor might not be teaching any courses in a given semester, so the
Professorentity would have partial participation.
- Total Participation (Double Line): Every entity instance must participate in the relationship. For example, if every course must have a professor assigned, the
Let's continue with the same article to solidify these concepts.
Now, let's learn how to define the rules of the connections between entities. The GeeksforGeeks article clearly explains cardinality and participation constraints.
Continue reading the sections 'Cardinality in ER Model' and 'Participation Constraint'. Pay close attention to the examples and diagrams for each type of cardinality and the visual distinction between total (double line) and partial (single line) participation.
Here is a complete, simple ER diagram that brings these concepts together.

From Requirements to Diagram: A Practical Walkthrough
Theory provides the tools, but the real skill in ER modeling is translating a description of a system into a diagram. This involves reading a problem statement, identifying the entities (nouns), attributes (properties), and relationships (verbs), and then defining the cardinality based on the stated rules.
The following video is an excellent walkthrough of this exact process. The instructor starts with a document describing a company's data requirements and builds the ER diagram step by step.
Designing an ER Diagram | SQL | Tutorial 22
Let's watch a practical example where the instructor takes a set of written business rules and translates them into a complete ER diagram. This will show you the exact thought process you need to develop.
Watch the entire video (around 12 minutes). Pay close attention to how the instructor: Reads the requirements document first. Identifies nouns as potential entities (e.g., Employee, Branch, Client). Identifies properties as attributes and unique identifiers as primary keys. Identifies verbs as potential relationships (e.g., 'works for', 'manages', 'supervises'). Determines the cardinality and participation for each relationship based on the business rules described in the text.
Test your understanding!
Consider a simple library system with the following rules:
- The library has many
Booksand manyMembers. - Each
Bookhas a uniqueISBNand atitle. - Each
Memberhas a uniquemember_idand aname. - A
Membercan borrow multipleBooks. ABookcan be borrowed by only oneMemberat a time.
How would you model the relationship between Book and Member? What are the entities and what is the cardinality of their relationship?
Show answer
-
Entities:
BookandMember. -
Relationship: A relationship like "borrows" would connect them.
-
Cardinality: The relationship is One-to-Many (1:N) from
BooktoMember. One member can borrow many books, but one specific book can only be borrowed by one member at a time.You could represent this as:
Member--(1)-- borrows --(N)--Book. (Note: different notations exist, but the concept is a member can have many books, a book has one member).
Conclusion
In this lesson, you've learned how to create a conceptual blueprint for a database using Entity-Relationship diagrams. This is the first and one of the most critical steps in database design.
Key Takeaways:
- ER diagrams are visual models used to plan the logical structure of a database.
- The three core components are Entities (real-world objects), Attributes (properties of entities), and Relationships (associations between entities).
- We use specific symbols to represent components like strong/weak entities, different attribute types (key, composite, multivalued, derived), and relationships.
- Cardinality (1:1, 1:N, M:N) and Participation Constraints (Total, Partial) define the business rules that govern the relationships between entities.
- The process of creating an ERD involves analyzing requirements to identify these components and their governing rules.
Preview of the Next Lesson:
Designing the ER diagram is like being an architect creating a blueprint. In our next lesson, "Translate an ER diagram into a relational schema," we'll act as the construction engineers. We will take the blueprint we've designed today and learn the formal rules for converting it into the actual structure of a relational database: tables, columns, primary keys, and foreign keys. You'll see exactly how each symbol in the ERD maps to a concrete database element.