Hello! Welcome to the third lesson in our "Foundations of Machine Learning" module.
In the last lesson, we covered the critical importance of splitting your data into training, validation, and test sets. This ensures we can get an unbiased estimate of our model's performance on new, unseen data. Now that we have our data neatly partitioned, we must prepare the data within those partitions. Raw data is rarely clean and ready for a machine learning algorithm.
This lesson focuses on two of the most common and essential data preprocessing steps. Your learning outcome is to handle missing values and apply feature scaling (normalization, standardization). These techniques are fundamental for building robust and high-performing models, and are a staple of any data science workflow, including those you'll encounter in the GATE exam.
A Crucial First Principle: Splitting Before Preprocessing
Before we dive in, let's establish a golden rule that connects to our last lesson: Any data preprocessing step that involves learning parameters from the data must be done after splitting the data.
Why? Imagine you calculate the average value of a feature to fill in missing entries. If you use the entire dataset (before splitting), you have calculated an average that includes information from your validation and test sets. This information has now "leaked" into your training set. Your model's performance will be artificially inflated because it has indirectly learned something about the data it's supposed to be tested on.
The correct workflow is:
- Split data into training, validation, and test sets.
- Learn the preprocessing parameters (like the mean for imputation or the min/max for scaling) only from the training set.
- Apply (or "transform") all three sets (training, validation, and test) using these learned parameters.
We will keep this rule in mind throughout the lesson.
Part 1: Handling Missing Values
Real-world datasets are often messy and incomplete. Values might be missing because they weren't recorded, were lost, or simply don't exist. Most machine learning algorithms in scikit-learn cannot function when they encounter missing values (often represented as NaN, or "Not a Number").

Identifying Missing Values
In pandas, you can quickly check for missing values in your DataFrame. If you have a DataFrame named df, you can run:
# This will show you the count of missing values in each column
df.isnull().sum()
Strategies for Handling Missing Values
There are two main approaches: deletion and imputation.
1. Deletion
You could simply delete rows (df.dropna()) or entire columns that contain missing values.
- Pros: It's simple.
- Cons: This is usually a bad idea. You risk throwing away valuable information. If a column has many missing values but is highly predictive, deleting it hurts your model. If many rows have at least one missing value, you could end up with a tiny dataset.
2. Imputation
Imputation is the process of filling in missing values. This is the preferred approach. The key is to make a reasonable guess about what the missing value might have been.
Common imputation strategies include:
- Mean: Replace missing values with the average of the column. Best for normally distributed data.
- Median: Replace missing values with the median of the column. This is more robust to outliers and a good default choice for numerical data.
- Most Frequent (Mode): Replace missing values with the most common value. This is the go-to method for categorical (non-numeric) features.
- Constant: Replace missing values with a fixed value, like 0, "missing", or "unknown". This can be useful if the fact that a value is missing is itself informative.
Practical Imputation with Scikit-Learn's SimpleImputer
The best way to learn this is to see it in action. The following video demonstrates how to use scikit-learn's SimpleImputer, which is the standard tool for this job.
Handling Missing Data in Python: Simple Imputer in Python for Machine Learning
This video from Ryan & Matt Data Science provides a clear, practical guide to using SimpleImputer in Python to handle missing values in both numerical and categorical columns.
Please watch the video from the beginning up to 08:09. Focus on the following: 00:00 - 01:09: The different strategies SimpleImputer offers. 01:09 - 02:46: How to create a DataFrame and identify missing values with .isna().sum(). 02:46 - 06:10: How to apply the 'mean', 'median', 'most_frequent', and 'constant' strategies to numerical data. 06:10 - 08:09: How to handle missing categorical data using the 'constant' strategy.
As you saw, the process is straightforward:
- Import
SimpleImputer. - Create an imputer object, specifying your chosen
strategy. - Fit the imputer on your training data (
imputer.fit(X_train)). - Transform your training, validation, and test data (
imputer.transform(X_train),imputer.transform(X_val), etc.).
Part 2: Feature Scaling
Now, let's look at another common issue. Imagine you have a dataset with two features: age (ranging from 20-70) and salary (ranging from 50,000-2,000,000). Many ML algorithms, particularly those that rely on distances or gradients, will be biased towards the salary feature simply because its numbers are much larger. Its scale dominates the age feature.
Feature scaling puts all features onto a similar scale so that they contribute more equally to the model's training process.
Why and When to Scale?
This next short video explains the intuition behind why scaling is so important for certain algorithms.
Standardization vs Normalization Clearly Explained!
This video from Normalized Nerd clearly explains why feature scaling is necessary for gradient-based and distance-based algorithms, using excellent visualizations.
Please watch the section from 02:55 to 05:16. Pay close attention to: The explanation of how different feature scales can cause oscillations in gradient descent, slowing down learning. The explanation of how features with larger scales can dominate distance calculations in algorithms like K-NN.
As the video and the following article explain, scaling is crucial for some models but not for others.
Feature Scaling: Standardization vs. Normalization
This blog post by Minkyung Kang provides a great summary of which models are sensitive to feature scale.
Please read the section titled 'Why Do We Need Scaling?'. Focus on the lists of 'ML Models sensitive to feature scale' and 'ML models not sensitive to feature scale'.
In short:
- Scale your data for: Linear/Logistic Regression, Neural Networks, SVM, K-NN, K-Means, and PCA.
- You don't need to scale for: Tree-based algorithms like Decision Trees, Random Forests, and Gradient Boosting.
Types of Feature Scaling
There are two primary methods of feature scaling you must know: Standardization and Normalization.
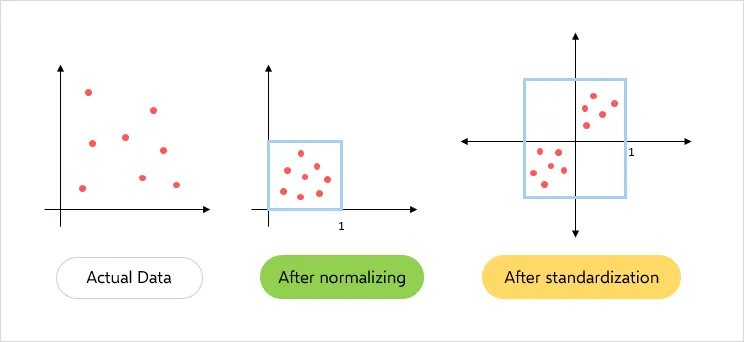
1. Standardization (Z-score Scaling)
Standardization rescales the data to have a mean of 0 and a standard deviation of 1.
- Formula:
- Intuition: It tells you how many standard deviations away from the mean each data point is.
- When to use: This is the most common scaling method and is a great default choice. It is less sensitive to outliers than normalization.
- Scikit-learn:
StandardScaler
2. Normalization (Min-Max Scaling)
Normalization rescales the data to a fixed range, usually [0, 1].
- Formula:
- Intuition: It squeezes all your data points into a specific range.
- When to use: Useful for algorithms that expect data in a bounded range (like some neural networks) or when you need your features on the exact same scale. It's very sensitive to outliers.
- Scikit-learn:
MinMaxScaler
To see the practical implementation and a more detailed comparison, please review the following sections of the blog post we looked at earlier.
Feature Scaling: Standardization vs. Normalization
This resource provides the formulas, pros, cons, and scikit-learn code for both Standardization and Normalization.
Please read the following sections: '1. Standardization': Focus on the definition, formula, and the Python code block showing how to use StandardScaler. '2.1. Min-max Normalization': Focus on the definition, formula, and the Python code block for MinMaxScaler. 'Summary': Review the excellent summary table that compares all scaling methods.
Test your understanding!
You are preparing data for a K-Nearest Neighbors (K-NN) model. You have a feature for 'income' with values from 30,000 to 500,000 and another feature for 'number of children' from 0 to 5.
- Why is feature scaling necessary here?
- You notice a few extreme outliers in the 'income' feature (e.g., a billionaire in the dataset). Between
StandardScalerandMinMaxScaler, which might be a more robust choice and why?
Show answer
- Feature scaling is necessary because K-NN is a distance-based algorithm. Without scaling, the 'income' feature's large values would completely dominate the distance calculation, making the 'number of children' feature almost irrelevant.
StandardScalerwould be a more robust choice.MinMaxScaleris very sensitive to outliers because theminandmaxvalues in its formula are determined by these extreme points. An outlier would cause the vast majority of 'normal' data points to be squished into a very small part of the [0, 1] range.StandardScaleris less affected because it uses the mean and standard deviation, which are less influenced by single extreme points than min/max are. (An even more robust option would beRobustScaler, which uses the median and interquartile range).
Conclusion
Congratulations! You have now learned how to perform two of the most critical steps in the data preprocessing pipeline. Clean, well-prepared data is the foundation of any successful machine learning project.
Key Takeaways:
- Always split your data before you preprocess it to avoid data leakage.
- Handle missing values using imputation (
SimpleImputer), typically with themedianormost_frequentstrategy. - Apply feature scaling for algorithms sensitive to feature magnitudes (e.g., K-NN, SVM, Linear Regression).
- Standardization (
StandardScaler) is a robust default choice for scaling, centering data at mean 0 with a standard deviation of 1. - Normalization (
MinMaxScaler) scales data to a fixed range (e.g., [0, 1]) but is sensitive to outliers. - Always fit your imputer and scaler only on the training data, and then use them to transform the training, validation, and test sets.
Preview of the Next Lesson:
We have organized our data with train/val/test splits and cleaned it by handling missing values and applying scaling. We are finally ready to build our first model! In the next lesson, we will dive into one of the simplest yet most important models in machine learning: you will learn to describe the mathematical formulation of a simple linear regression model.