Hello! Let's continue our journey through the "Foundations of Machine Learning" module.
In our last lesson, we explored the k-Nearest Neighbors (k-NN) algorithm. We saw that it's a non-parametric, distance-based model that makes predictions by looking at the "neighborhood" of a data point. Today, we shift our focus back to parametric models, similar in spirit to the linear regression model you studied earlier.
Our learning outcome for this lesson is to implement logistic regression for binary classification tasks. Despite its name, logistic regression is a classification algorithm, not a regression one. It is one of the most fundamental and widely used algorithms for problems where the outcome is one of two categories, like "yes/no," "spam/not-spam," or "true/false."
1. Why Not Linear Regression for Classification?
Before we dive into what logistic regression is, let's understand the problem it solves. We have a classification task where the output is categorical (e.g., 0 or 1). Your first thought might be: why can't we just use linear regression, which we already know?
While it seems plausible, linear regression is not suited for classification. The following video explains this very clearly.
Machine Learning Tutorial Python - 8: Logistic Regression (Binary Classification)
Watch this section from the 'Machine Learning Tutorial Python - 8: Logistic Regression' video by codebasics. It uses a practical example to show the limitations of using a straight line (linear regression) to classify data.
Please watch from the beginning to 04:57. Focus on: The difference between a regression problem (predicting a continuous value) and a classification problem (predicting a category). How fitting a linear regression line to a binary (0/1) output can lead to nonsensical predictions (e.g., probabilities greater than 1 or less than 0). How outliers can drastically shift the linear regression line, causing incorrect classifications.
As the video demonstrates, linear regression can produce outputs outside the 0-1 range and is sensitive to outliers in a way that is problematic for classification. We need a model that is specifically designed to output a probability between 0 and 1.
2. The Core Idea: The Sigmoid Function
Logistic regression elegantly solves this problem by adding a crucial step to the linear model. It first calculates a linear combination of the input features (just like linear regression) and then passes this result through a special function called the sigmoid (or logistic) function.
The sigmoid function takes any real number and "squashes" it into the range between 0 and 1.
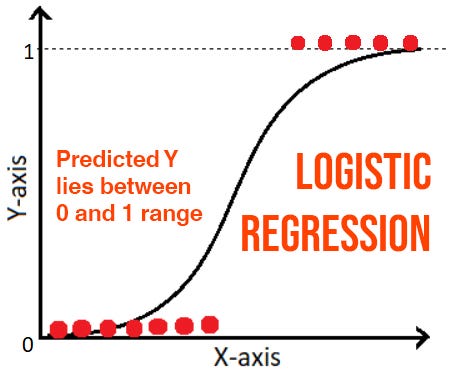
The mathematical formula for the linear part and the sigmoid transformation is:
- Linear Step: Calculate , which is a linear combination of features with weights and a bias .
- Sigmoid Step: Apply the sigmoid function, , to get the predicted probability, .
The resulting value, , is the estimated probability that the output is "1". For example, if our model outputs , it's predicting an 80% chance that the instance belongs to class 1.
To make a final classification (0 or 1), we use a decision threshold, which is typically 0.5.
- If , we predict class 1.
- If , we predict class 0.
This threshold creates a linear decision boundary that separates the two classes in the feature space.

For a deeper look at the mathematics and the role of the sigmoid function, the following video and article are very helpful.
Machine Learning Tutorial Python - 8: Logistic Regression (Binary Classification)
Let's continue with the codebasics video to see how the sigmoid function transforms a linear equation into the S-shaped curve we need.
Watch the segment from 04:57 to 08:06. The key takeaway is understanding that logistic regression is essentially a linear model wrapped inside a sigmoid function.
Logistic Regression in Machine Learning
The article 'Logistic Regression in Machine Learning' from GeeksForGeeks provides a concise summary of the math. Reading this will solidify your understanding of the formulas.
Please read the sections titled 'Understanding Sigmoid Function' and 'How does Logistic Regression work?'. This will reinforce the concepts of the S-shaped curve, the decision threshold, and the two-step process (linear calculation followed by sigmoid transformation).
Test your understanding!
A logistic regression model has learned its weights and bias. For a new data point, it computes the linear part as .
- Given the sigmoid function , what is the predicted probability ? You can use a calculator (e is approx. 2.718).
- Using a decision threshold of 0.5, what is the final predicted class (0 or 1)?
Show answer
- The predicted probability is .
- Since the probability is greater than the threshold of 0.5, the final predicted class is 1.
3. Implementing Logistic Regression with scikit-learn
Now, let's put this theory into practice. As with other algorithms, scikit-learn makes implementing logistic regression straightforward. The process follows the standard steps you've learned: import, instantiate, fit, and predict.
The next segment of the codebasics video provides a complete walkthrough of implementing logistic regression in Python to solve a binary classification problem.
Machine Learning Tutorial Python - 8: Logistic Regression (Binary Classification)
This is the practical core of our lesson. Watch how to use the LogisticRegression class from scikit-learn.
Watch from 08:06 to 13:52. Follow these key implementation steps: Load data into a Pandas DataFrame. Split data into training and test sets using train_test_split. Import LogisticRegression from sklearn.linear_model. Create an instance of the model: model = LogisticRegression(). Train the model on the training data: model.fit(X_train, y_train). Make predictions on the test data: model.predict(X_test).
The code to implement logistic regression is very concise. For example, using the breast cancer dataset, the core logic is just a few lines:
from sklearn.datasets import load_breast_cancer
from sklearn.linear_model import LogisticRegression
from sklearn.model_selection import train_test_split
from sklearn.metrics import accuracy_score

# 1. Load and split data
X, y = load_breast_cancer(return_X_y=True)
X_train, X_test, y_train, y_test = train_test_split(X, y, test_size=0.20, random_state=23)

# 2. Create and train the model
# max_iter is increased to ensure the model converges
clf = LogisticRegression(max_iter=10000, random_state=0)
clf.fit(X_train, y_train)

# 3. Make predictions and evaluate
y_pred = clf.predict(X_test)
acc = accuracy_score(y_test, y_pred)
print(f"Model accuracy: {acc:.2f}")

# Output: Model accuracy: 0.96
This example is also shown in the GeeksForGeeks article in section 4.
To get a more in-depth guide on the implementation details and the various parameters you can tune in scikit-learn's LogisticRegression class, the following resource is excellent.
The article 'Logistic Regression in Python' by Real Python provides a very detailed, step-by-step walkthrough. It's a great reference for understanding the different knobs you can turn when building your model.
Please read the section 'Logistic Regression in Python With scikit-learn: Example 1'. This covers the same steps as the video but in a textual format and explains important parameters of the LogisticRegression class like solver, C, and penalty.
4. Model Training and Evaluation
How does the model "learn" the best weights () and bias ()? In the linear regression lesson, you saw that gradient descent was used to minimize the Mean Squared Error (MSE). Logistic regression uses a similar process but with a different cost function called Log Loss (or Binary Cross-Entropy). The goal is to find the parameters that minimize this log loss, which effectively maximizes the probability of the model assigning the correct labels to the training data.
After training, you can evaluate the model. The most straightforward metric is accuracy, which you can get with the .score() method. You can also see the predicted probabilities for each class using .predict_proba().
Machine Learning Tutorial Python - 8: Logistic Regression (Binary Classification)
Let's quickly see how to check the model's accuracy and get the predicted probabilities.
Watch this final clip from 13:52 to 15:44. Note the difference between .predict(), which gives the final class (0 or 1), and .predict_proba(), which gives the probability for each class.
While accuracy is a good start, other metrics like the confusion matrix, precision, and recall give a more complete picture of a classifier's performance. We'll explore these in detail in the next module, but the Real Python article you read gives you a first look at them.
Conclusion
You have now learned how to implement logistic regression, a cornerstone algorithm for binary classification. It serves as a powerful bridge between the simple linear models and more complex classification techniques.
Key Takeaways:
- Logistic regression is a parametric algorithm for classification, not regression.
- It works by passing a linear combination of inputs through a sigmoid function to produce an output between 0 and 1, which is interpreted as a probability.
- A decision threshold (usually 0.5) is used to convert this probability into a final class prediction (0 or 1).
- The model is trained by finding the parameters that minimize a cost function called log loss (or cross-entropy).
- Implementation in
scikit-learnis straightforward using theLogisticRegressionclass.
Preview of the Next Lesson:
In our next lesson, we will explore Decision Trees. This model takes a completely different approach. Instead of learning a single linear boundary, it learns a set of hierarchical rules, creating a tree-like structure to make predictions. Decision trees are highly interpretable and form the basis for more advanced algorithms like Random Forests.