Introduction
Welcome back to our module on the Foundations of Systems Thinking. In our last lesson, we defined a system by its three core components: elements, interconnections, and a purpose. We saw that understanding the interconnections and purpose is often more critical than just listing the elements.
Today, we take the next step in analyzing a system's structure. We will focus on the fundamental building blocks that make up those interconnections: stocks and flows. Your learning outcome for this lesson is to differentiate between stocks and flows to map the structure of a system.
Mastering this distinction is essential. It allows us to move from a static picture of a system to a dynamic understanding of how it changes over time. This skill is the prerequisite for creating the causal loop diagrams we'll use later to diagnose the system archetypes in your FLATS GEDS mnemonic.
1. Defining Stocks and Flows: The Bathtub and the Bank Account
At the most basic level, every system's structure can be described using just two types of variables: stocks and flows.
- A stock is an accumulation of something. It's a quantity that can be measured at a specific point in time, like a snapshot. Stocks represent the state of the system and give it memory and inertia.
- A flow is a rate that changes a stock over time. Flows are the actions or activities that cause stocks to increase (inflows) or decrease (outflows).
The most common analogy is a bathtub.
Thinking in Systems, Key Ideas (Ch. 1)
This video provides a very clear introduction to the concept of stocks and flows using the classic bathtub analogy.
Please watch the segment from 08:24 to 09:39. Focus on how the water level represents the stock, while the faucet and drain represent the inflow and outflow, respectively.
As the video explains:
- Stock: The amount of water in the tub. You can measure it at any instant.
- Inflow: The rate at which water enters from the faucet (e.g., litres per minute).
- Outflow: The rate at which water leaves through the drain (e.g., litres per minute).
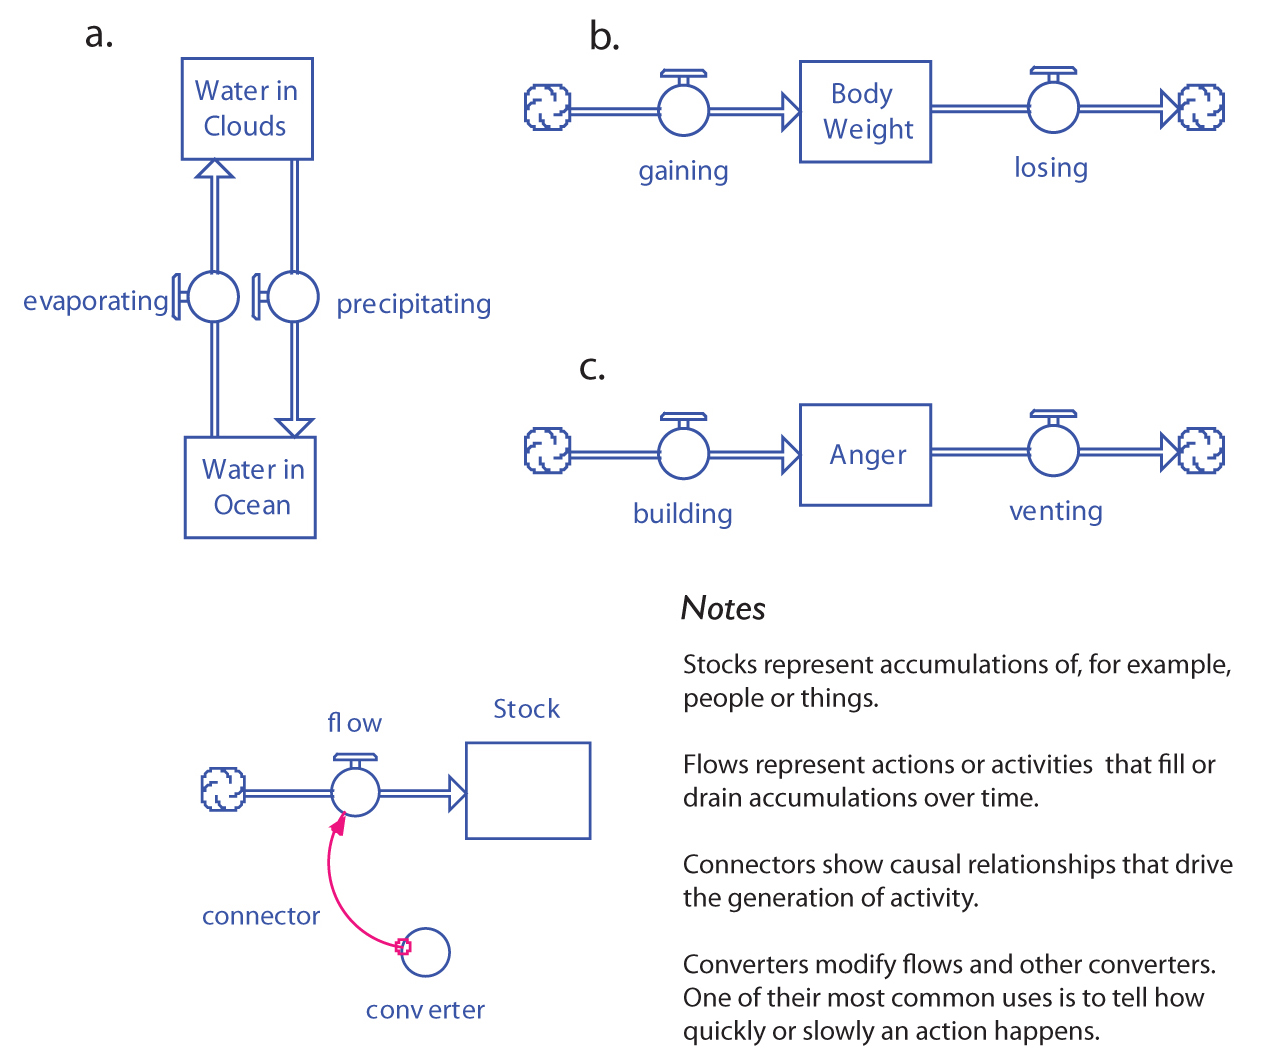
This "hydraulic metaphor" is a cornerstone of system dynamics. It highlights a critical point: you cannot change a stock directly. You can only influence it by adjusting its flows.
System Dynamics: Systems Thinking and Modeling for a Complex World
Let's reinforce this with a slightly more technical explanation from an MIT course on System Dynamics. This clip also uses the bathtub metaphor and provides other useful examples.
Watch from 36:27 to 38:09. Note the examples given, such as a balance sheet (stock) vs. a cash flow statement (flow), and wealth (stock) vs. income (flow).
Given your background in statistics and probability theory, you can think of this relationship in terms of calculus. A stock is the integral of its net flow over time, while the net flow is the derivative of the stock.
The stock at any time is its initial value plus the accumulated net flow:
Conversely, the net rate of change of the stock is simply the difference between the inflow and the outflow:
This mathematical precision, as explained in the article "STOCK-AND-FLOW THINKING IN DECISION MAKING," is what makes these concepts so powerful for modeling.
2. How to Tell a Stock from a Flow
Distinguishing between stocks and flows is a crucial skill. Here are three practical techniques to help you.
Step-By-Step Stocks and Flows: Improving the Rigor of Your Thinking
This article, 'Step-By-Step Stocks and Flows,' provides a clear, practical method for distinguishing between these two types of variables.
Please read the section titled 'Overview of Stocks and Flows.' Pay special attention to the 'time stop' technique.
Let's summarize the techniques from the article and other sources:
-
The Time-Stop Test: Imagine freezing time completely.
- Stocks would still have a measurable value (e.g., the water in the tub, money in your account, people in a room). They are accumulations.
- Flows would become zero. You can't measure a rate like "sales per week" or "births per year" in an instant. They are actions.
-
The Units Test: Check the units of measurement.
- Stocks are measured in simple units (e.g., dollars, bras, people).
- Flows are measured in units per unit of time (e.g., dollars/month, bras/week, people/year).
-
The Grammar Test: When describing a system, listen to the language used.
- Nouns often represent stocks (e.g., Inventory, Population, Savings).
- Verbs often represent flows (e.g., producing, migrating, saving).
This distinction is more than academic. As the article Step-By-Step Stocks and Flows also points out (in the section "Differences Between CLDs and Stock and Flow Diagrams"), differentiating stocks and flows provides a more accurate and rigorous understanding of a system's dynamics than a simple causal loop diagram alone.
3. Application: Mapping Your Worlds
Let's apply this framework to your two areas of interest.
Application 1: Bra Production Inventory
Consider the system for managing the inventory of a successful cleavage-enhancing bra design.
- Stock: The number of bras in the warehouse. This is a stock. At any moment, you can stop time and count them. Its unit is "bras".
- Inflow: The production rate. This is a flow. It's measured in "bras per week". It increases the stock.
- Outflow: The sales rate. This is also a flow, measured in "bras per week". It decreases the stock.
Mapping this simple stock-and-flow structure reveals the core dynamic of inventory management. If the outflow (sales) consistently exceeds the inflow (production), the stock (inventory) will inevitably drain to zero, resulting in lost sales and frustrated customers. This structure is the foundation for analyzing more complex problems you'll see later in the FLATS GEDS mnemonic, such as 'Growth and Underinvestment'.
Application 2: The Emotional Bank Account in a Vee Relationship
Now, let's map a social system. As a social researcher, you are accustomed to modeling human dynamics. The stock-and-flow structure provides a powerful language for this. A well-known metaphor is the "Emotional Bank Account."

Let's apply this to one of the dyadic relationships within a Vee structure (e.g., between the Hinge and one Metamour).
- Stock: Relational Capital or Goodwill. This is the accumulation of trust, intimacy, and positive feeling in the relationship. It’s an intangible stock, but it's very real. It provides the relationship with resilience and a buffer against conflict.
- Inflows (Deposits): The rate of positive interactions. This includes actions like expressing gratitude, providing support, spending quality time, and acts of kindness. These are flows, measured in "positive events per week."
- Outflows (Withdrawals): The rate of negative interactions. This includes criticism, broken promises, neglect, or invalidation. These are also flows, measured in "negative events per week."
The stability of the relationship depends on the state of this stock. If withdrawals consistently outpace deposits, the stock of goodwill depletes. When it's empty, the relationship is in overdraft and becomes highly unstable. This framing connects directly to the "labor management" concepts from the article vee structure polyamory labor management we discussed in the last lesson. Managing emotional labor is, in essence, managing the flows that maintain the stock of relational capital.
Conclusion
In this lesson, you learned to deconstruct a system's structure into its fundamental dynamic components: stocks and flows.
Key Takeaways:
- Stocks are accumulations, representing the state of a system at a point in time (e.g., inventory, wealth, trust). They provide a system with inertia and memory.
- Flows are rates of change that cause stocks to increase or decrease over time (e.g., production, spending, acts of kindness).
- You can identify stocks and flows using the time-stop test, the units test, or the grammar test.
- Mapping stocks and flows is the first step toward creating a dynamic model of a system, allowing us to understand how its behavior unfolds over time.
You now have the primary building blocks for mapping system structure. In our next lesson, we will see how these blocks connect to form feedback loops. We'll start with reinforcing feedback loops, the engines of exponential growth and collapse, bringing us one step closer to diagnosing the systemic problems in your FLATS GEDS framework.