Introduction
Welcome to our final lesson on the foundations of systems thinking. In our previous lessons, we've deconstructed systems into their core components: variables (stocks and flows), feedback loops (reinforcing and balancing), and the crucial element of delays. You've analysed how these components interact to produce behaviours like growth, stability, and oscillation.
Today, we transition from analysis to synthesis. Your learning outcome is to create a basic causal loop diagram (CLD) for a given scenario in either lingerie production or relationship dynamics. You will learn the practical, step-by-step process of translating a real-world situation into a systems map. This skill is the culmination of this module and the essential tool we will use for the rest of the course to diagnose and address complex problems.
1. The Art of Building a Causal Loop Diagram
A Causal Loop Diagram is essentially a story told in a specific language. It has nouns (the variables), verbs (the causal links), and a plot (the behaviour generated by the feedback loops). As a statistician, you are accustomed to defining relationships between variables; a CLD provides a visual and qualitative framework to map the feedback structures that often drive those relationships.
To learn this "language," let's start with a clear, structured guide.
Causal Loop Construction: The Basics
The article 'Causal Loop Construction: The Basics' from The Systems Thinker provides an excellent, concise framework for building CLDs. It breaks the process down into four clear steps.
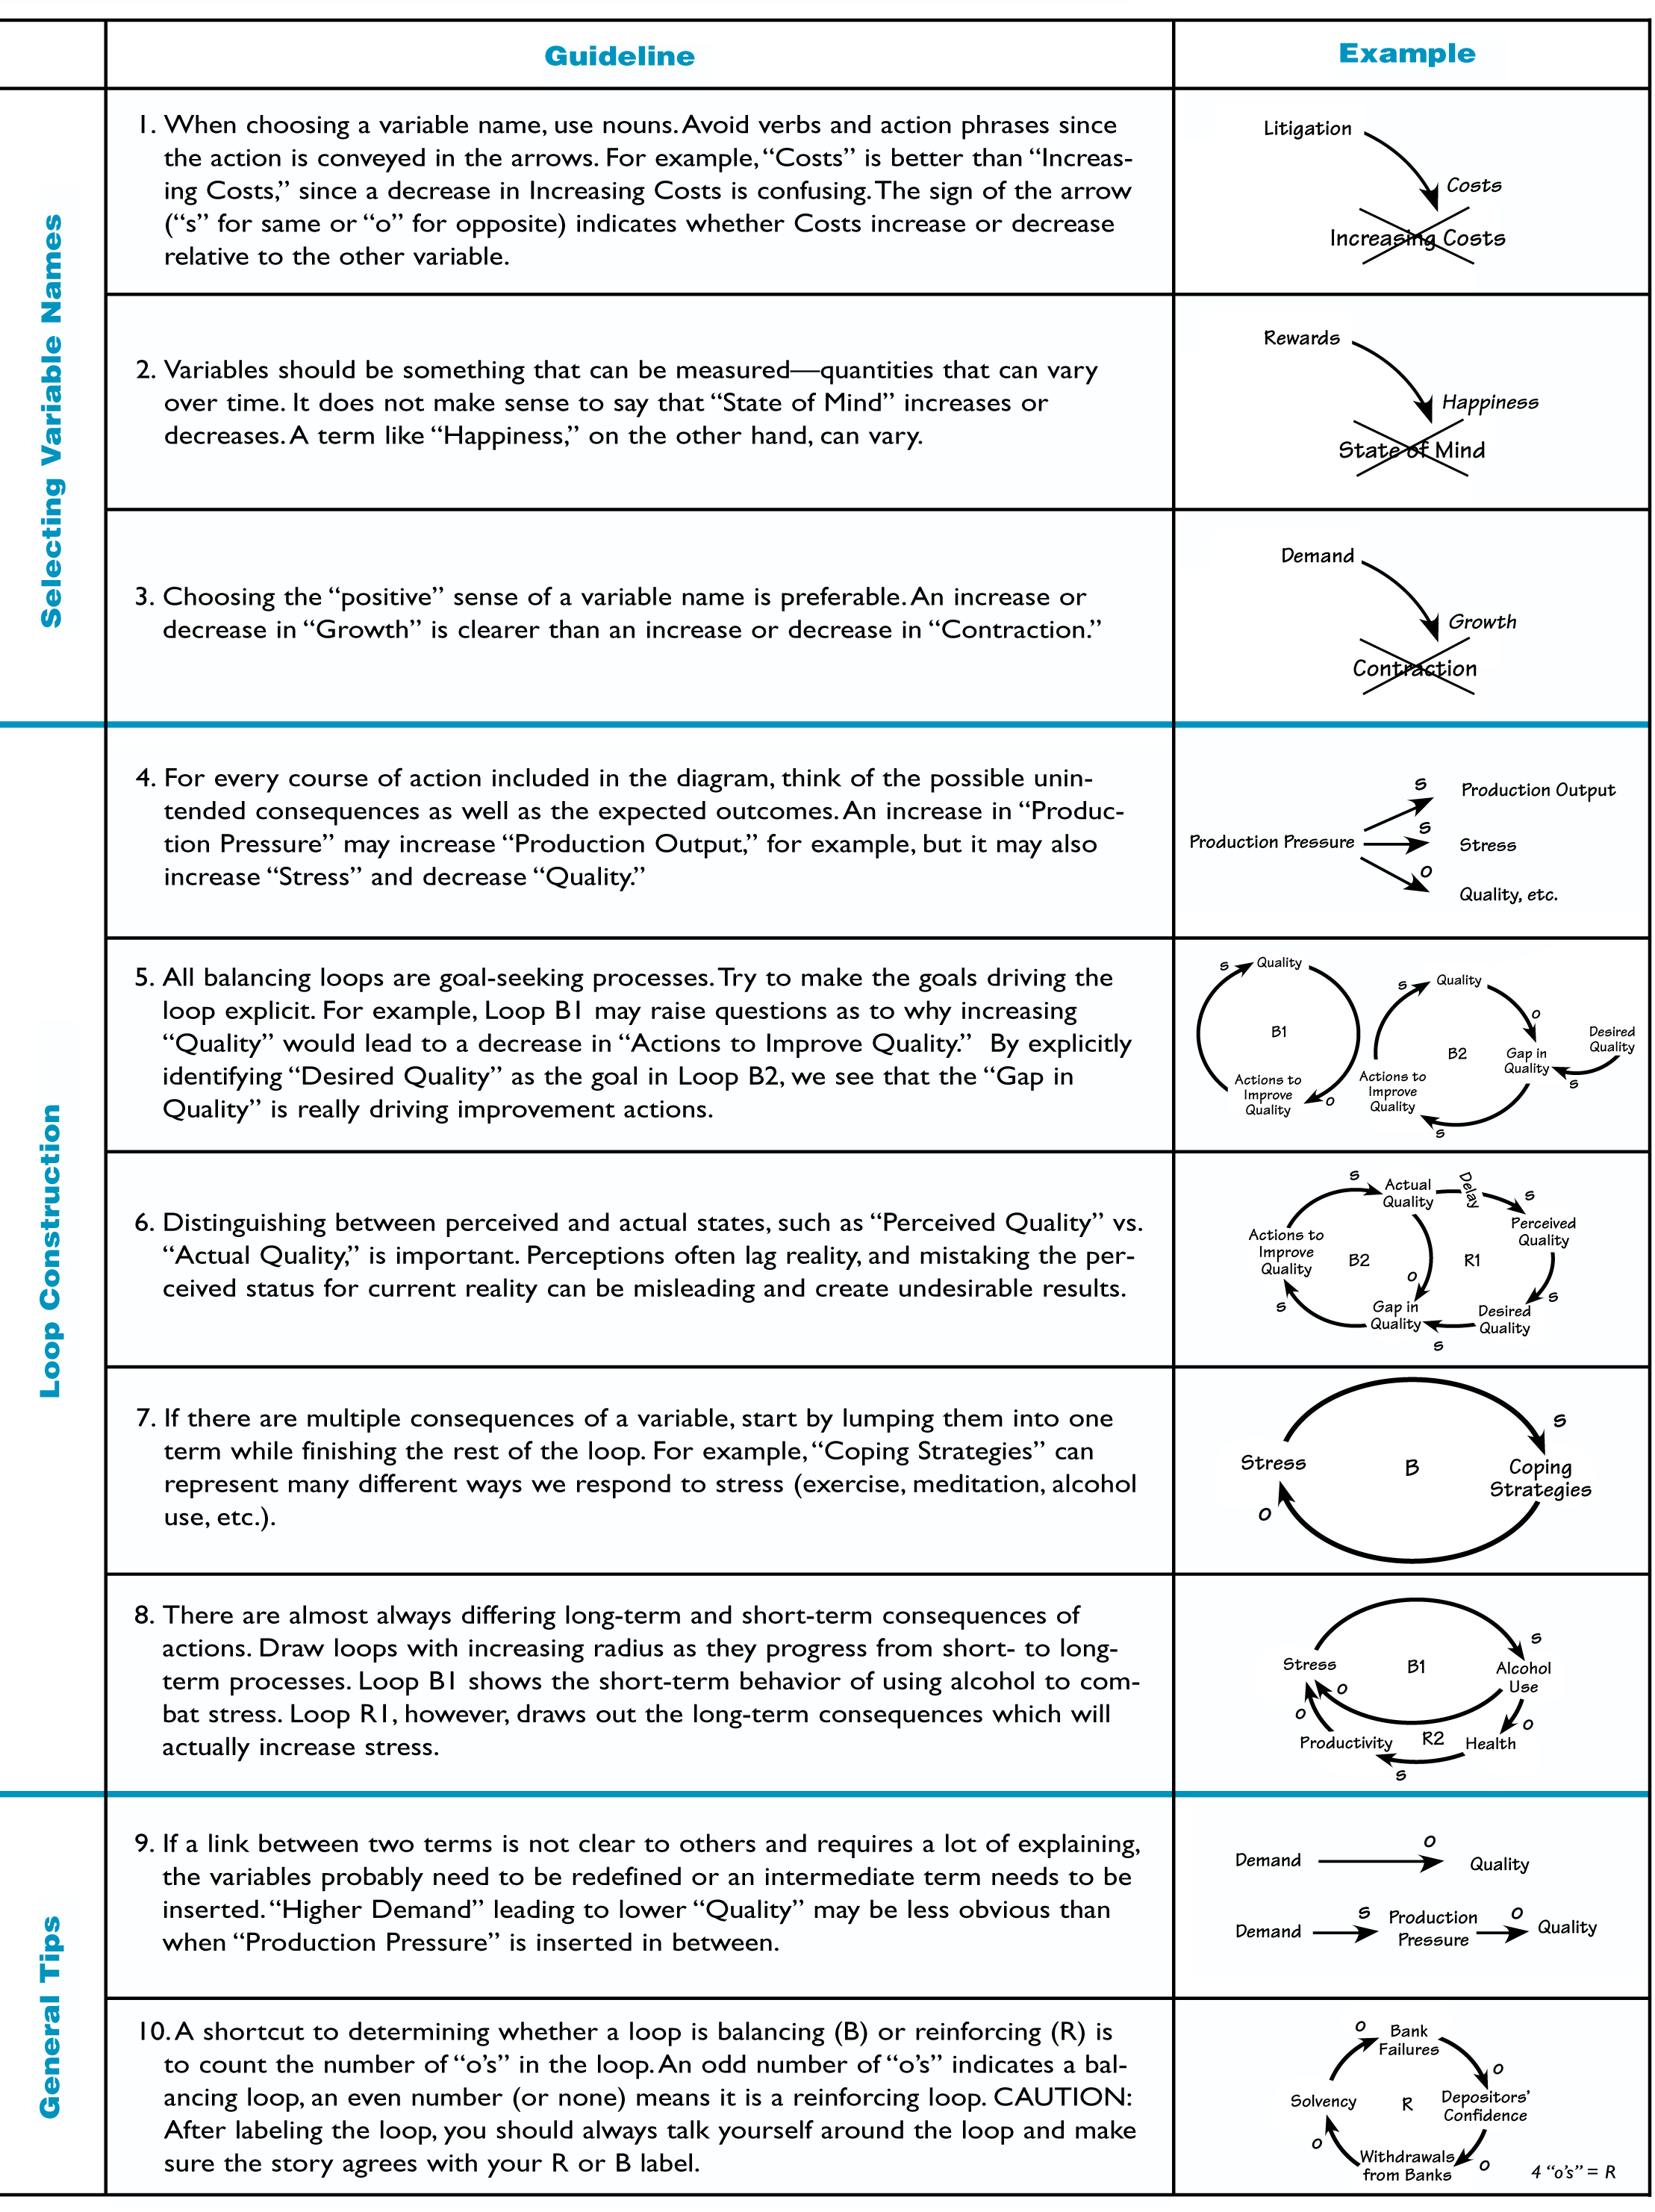
Please read the entire article, from the introduction to the 'Storytelling' section. Focus on understanding the four key steps it outlines: Create Variable Names: Identifying the 'nouns' of your system. Draw the Links: Connecting the variables with 'verbs' and assigning polarity ('s' for same, 'o' for opposite). Label the Loop: Determining if the loop is Reinforcing (R) or Balancing (B). Talk Through the Loop: Ensuring the diagram accurately tells the story of the system's behaviour.
To supplement this, here is a helpful reference image that provides more detailed guidelines and best practices for each step. Think of it as a "style guide" for drawing clear and effective diagrams.
2. Guided Example: A Lingerie Product Launch
Let's apply these four steps to a scenario from your professional interest: the launch of a new cleavage-enhancing bra.
Scenario: A lingerie company launches a successful new bra. The initial sales generate profit, which the company reinvests into a marketing campaign. The campaign attracts more customers, further boosting sales.
Step 1: Identify the Variables
The key "nouns" or quantities that are changing are:
Sales of New BraCompany ProfitMarketing Spend
Step 2: Draw the Links and Assign Polarity
We now connect these variables with arrows and determine the relationship. We'll use + for "same direction" and - for "opposite direction," as this is a common convention alongside "s" and "o".
- An increase in
Sales of New Braleads to an increase inCompany Profit. The variables move in the same direction.
Sales of New Bra->Company Profit(+) - An increase in
Company Profitallows for an increase inMarketing Spend. Same direction.
Company Profit->Marketing Spend(+) - An increase in
Marketing Spendleads to an increase inSales of New Bra. Same direction.
Marketing Spend->Sales of New Bra(+)
Step 3: Label the Loop
To determine the loop type, we count the number of negative (- or o) links. In this case, there are zero. An even number of negative links (or zero) results in a Reinforcing (R) loop. This loop will produce exponential growth.
Step 4: Talk Through the Loop
Our diagram tells a clear story: "As sales of the new bra increase, profits grow. A portion of this profit is reinvested into marketing, which in turn drives more sales. This creates a virtuous cycle of growth."
The following video provides a dynamic walkthrough of building similar diagrams.
Systems Thinking 101 | Anna Justice | TEDxFurmanU
In this TEDx talk, Anna Justice demonstrates the process of building CLDs for complex issues like fast fashion and industrial agriculture. Watching her construct the diagrams live will help solidify the four-step process.
Please watch the segment from 04:07 to 05:53. Notice how she identifies variables for the clothing industry (demand, production, marketing, profit) and connects them with arrows and positive signs to build a reinforcing loop, just as we did in our example.
3. Guided Example: Managing Closeness in a Vee Relationship
Now, let's apply the same structured process to your other area of interest: navigating a Vee relationship.

Scenario: In a Vee relationship, the wife feels a need for more emotional connection with her husband (the hinge). She perceives a gap between the closeness she desires and what she currently feels. To address this, the couple intentionally schedules more quality time together. As they spend this time together, her feeling of connection increases, and the perceived gap closes.
Step 1: Identify the Variables
Perceived Emotional Connection(the wife's feeling)Gap in Connection(the difference between desired and actual connection)Quality Time Together
Step 2: Draw the Links and Assign Polarity
- As
Perceived Emotional Connectionincreases, theGap in Connectiondecreases. The variables move in opposite directions.
Perceived Emotional Connection->Gap in Connection(-) - As the
Gap in Connectionincreases (i.e., becomes more noticeable), the couple makes a greater effort to increase theirQuality Time Together. Same direction.
Gap in Connection->Quality Time Together(+) - As
Quality Time Togetherincreases, the wife'sPerceived Emotional Connectionincreases. Same direction.
Quality Time Together->Perceived Emotional Connection(+)
Step 3: Label the Loop
Counting the negative links, we find one. An odd number of negative links creates a Balancing (B) loop. This loop is goal-seeking; it tries to eliminate the Gap in Connection.
Step 4: Talk Through the Loop
The story of this loop is: "When the wife perceives a gap in emotional connection, the couple responds by dedicating more quality time together. This action increases her feeling of connection, which in turn reduces the gap. The system works to maintain the desired level of emotional connection."
4. Your Turn to Practice
Now it's time for you to build two basic CLDs. For each scenario below, work through the four steps: identify variables, draw and label the links, identify the loop type, and be prepared to "tell the story." You can sketch the diagrams on paper.
Scenario 1: The Lingerie Quality Spiral
A lingerie company, facing financial pressure, decides to use a cheaper, lower-quality fabric for its products. This leads to an increase in customer complaints and product returns. The rise in returns damages the brand's reputation. As the brand's reputation suffers, sales begin to fall, increasing the financial pressure on the company, which reinforces the initial decision to use cheaper materials.
Scenario 2: The Relationship Jealousy Regulator
In a Vee relationship, the husband's time spent with his metamour sometimes triggers feelings of jealousy in his wife. As the wife's jealousy increases, it leads to more conflict within their marriage. This conflict creates stress for the husband. As his stress level rises, his capacity or desire to spend time with his metamour decreases.
Take about 15 minutes to map these two systems. This exercise is the core of today's lesson, so focus on applying the process methodically.
Conclusion
You have now learned and practiced the fundamental skill of systems thinking: creating a causal loop diagram. This process transforms ambiguous stories into clear, structured maps that reveal the underlying forces at play.
Key Takeaways:
- Creating a CLD is a four-step process: identify variables, draw and label links, identify the loop type (R or B), and tell the story.
- Variables should be nouns or noun phrases that can change over time.
- Links represent causal influence, with polarity (
+/sor-/o) indicating if the variables move in the same or opposite directions. - Reinforcing loops (even/zero negative links) create accelerating change, while Balancing loops (odd number of negative links) are goal-seeking and stabilizing.
You have now mastered the complete set of foundational tools for systems thinking.
Next Lesson Preview:
In our next lesson, we will begin Module 5, "Diagnosing System Limiters: Part 1." You will use your new CLD creation skills to identify and analyse common problematic patterns known as system archetypes. We will start with one of the most common archetypes: "Fixes that Backfire."