Welcome back! In the previous lesson, you achieved a major milestone by containerizing our entire e-commerce platform and orchestrating it with a single docker-compose.yml file. Our disparate services now function as a cohesive system, with networking, dependencies, and configuration managed declaratively.
This lesson is the moment of truth. We will test the complete, end-to-end flow of our application. Our goal is to trace a single user action—placing an order—from the initial HTTP request at the API Gateway, through the synchronous gRPC calls, and all the way to the asynchronous, event-driven post-processing performed by our backend services. By the end, you will have validated that our entire architecture works together as designed.
1. The Anatomy of an End-to-End Flow
Before we run the test, let's visualize the journey of a request through our system. It's a hybrid flow, combining two distinct communication patterns that we've discussed throughout this course: request-response and event-driven.
Phase 1: The Synchronous Request
This is the immediate, blocking part of the interaction. The client needs a quick confirmation that their order has been accepted.
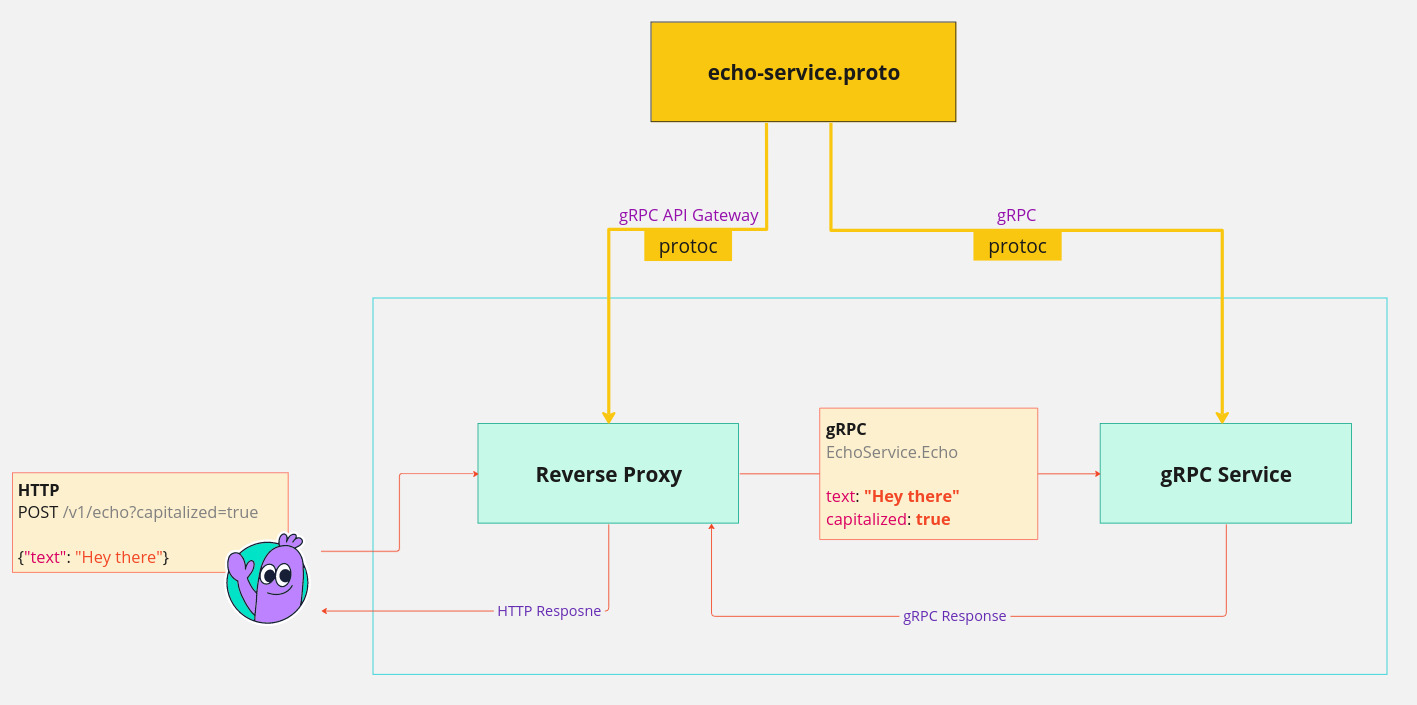
The sequence is:
- A client sends an
HTTP POSTrequest to the/ordersendpoint on our FastAPI API Gateway. - The gateway validates the request and makes a synchronous, unary gRPC call to the Order Service.
- The Order Service performs its initial logic (e.g., creates an order entry with a "PENDING" status) and immediately returns a success response to the API Gateway.
- The gateway translates this back into an
HTTP 201 Createdresponse for the client.
From the client's perspective, the interaction is now complete. But for our system, the work is just beginning.
Phase 2: Asynchronous Post-Processing
After sending the synchronous response, the Order Service publishes an OrderCreated event to a Redis Stream. This decouples the initial order creation from all the subsequent processing, making the system more resilient and scalable.
Event-Driven Architecture (EDA) vs Request/Response (RR)
To reinforce this distinction, watch this short clip from Confluent that compares Request/Response (RR) with Event-Driven Architecture (EDA).
Watch the comparison of how services react to an order. This maps directly to our two phases: the initial direct call (RR) and the subsequent event processing (EDA). Then, pay attention to the explanation of loose coupling. This is the key reason we use events for post-processing—the Inventory and Payment services don't need to be online at the exact moment an order is created.
The complete flow, including both phases, looks like this:
Client ---HTTP POST /orders---> [API Gateway]
   |                                  |
   |                            gRPC Call
   |                                  |
   '---<--- HTTP 201 Created --- [Order Service] --publishes 'OrderCreated' event--> [Redis Stream]
                                                                                     |
                                                                                 (async)
                                                                                     |
                                           +-----------------------------------------+
                                           |                                         |
                                     [Inventory Svc]                           [Payment Svc]
                                     (consumes event,                           (consumes event,
                                      reserves stock)                              processes payment)
Now, let's trigger this entire chain reaction and watch it happen live.
2. Hands-On: A Live End-to-End Test
In this exercise, we will act as a client, send a request to create an order, and then become detectives, following the trail of that order through the system's logs, message broker, and database.
Step 1: Start the System
Open a terminal in the root of your microservices-platform project and start all the services in detached mode. The --build flag ensures we're using the latest version of your code.
docker-compose up --build -d
Confirm that all services are running and healthy.
docker-compose ps
You should see all your containers (api-gateway, user-service, order-service, etc.) in the Up state.
Step 2: Tail the Logs
To see the story unfold, we need to watch the logs of the key actors. Open four separate terminal windows. In each one, run one of the following commands:
Terminal 1 (API Gateway):
docker-compose logs -f api-gateway
Terminal 2 (Order Service):
docker-compose logs -f order-service
Terminal 3 (Inventory Service):
docker-compose logs -f inventory-service
Terminal 4 (Payment Service):
docker-compose logs -f payment-service
Arrange these windows so you can see them all at once.
Step 3: Trigger the Flow
Now, let's act as a client. In a fifth terminal, create a simple Python script named test_client.py to send the HTTP request to our running API Gateway.
# test_client.py
import requests

GATEWAY_URL = "http://localhost:8000/orders"


# This payload assumes your Order Service expects these fields.
# Adjust if your implementation is different.
order_data = {
    "user_id": "user-from-e2e-test",
    "items": [
        {"product_id": "laptop-x1", "quantity": 1},
        {"product_id": "monitor-z1", "quantity": 2}
    ]
}

try:
    response = requests.post(GATEWAY_URL, json=order_data)
    response.raise_for_status()  # Raises an HTTPError for bad responses (4xx or 5xx)

    print(f"✅ Success! Order created.")
    print(f"   Status Code: {response.status_code}")
    print(f"   Response: {response.json()}")

except requests.exceptions.RequestException as e:
    print(f"❌ Failed to create order: {e}")
Run the script:
python test_client.py
If everything in the synchronous path works, you will see a ✅ Success! message.
Step 4: Observe and Verify
This is the exciting part. As soon as you run the script, watch your four log terminals. You should see a cascade of activity:
- API Gateway Log: You'll see an incoming
POST /ordersrequest, followed by a log message indicating it's making a gRPC call to the Order Service. - Order Service Log: It will log the receipt of the gRPC call and, crucially, a message like "Publishing OrderCreated event...".
- Inventory Service Log: A moment later, it will spring to life, logging "Consumed OrderCreated event..." and a message about reserving stock.
- Payment Service Log: Similarly, it will log that it has consumed the
OrderCreatedevent and is initiating payment processing.
The trail doesn't end with the logs. Let's verify the state of the system.
Verify the Event in Redis:
Check if the OrderCreated event was actually written to the stream.
# Check the number of events in the stream
docker-compose exec redis redis-cli XLEN order_events


# Read the latest event from the stream
docker-compose exec redis redis-cli XREVRANGE order_events + - COUNT 1
Verify the Payment Record in PostgreSQL:
Connect to the database and see if the Payment Service created a record.
# Connect to the psql client
docker-compose exec postgres psql -U your_db_user -d payments_db


# Once inside the psql prompt, run a query:
SELECT * FROM payments ORDER BY created_at DESC LIMIT 1;


# Type \q to exit psql
You should see a new row in the payments table corresponding to the order you just created.
If you've successfully followed this trail from HTTP request to database record, congratulations! You have just performed a full end-to-end test of your microservices application.
3. Exploring a Reference Architecture: OrderShop v2
To solidify these concepts, let's explore a similar, publicly available reference application from Redis. This will show you the same patterns we're using in a slightly different implementation, which is excellent for broadening your understanding.
How to Use Redis in Infrastructure Microservices
This article introduces "OrderShop v2", a sample e-commerce application built with Python, gRPC, and Docker Compose that demonstrates event-driven patterns.
First, read the introduction and the "OrderShop v2 architecture" section. Notice its CQRS pattern and how it separates a Message Queue for commands from an Event Store for events. Next, follow the "Run and fun" section. Clone the repository and use docker-compose up to start the application. Once it's running, the most interesting part is the simple UI provided at http://localhost:5000/. Open it in your browser to watch events appear in real time. Finally, trigger some activity by running the client tests: python -m unittest tests/unit.py. Switch back to the browser UI and watch the new events generated by the test script. This provides a great visual confirmation of an end-to-end flow.
4. From Manual to Automated Testing
Our manual test was invaluable for understanding the flow, but it's not scalable for a real project. In a production environment, you would automate this process.
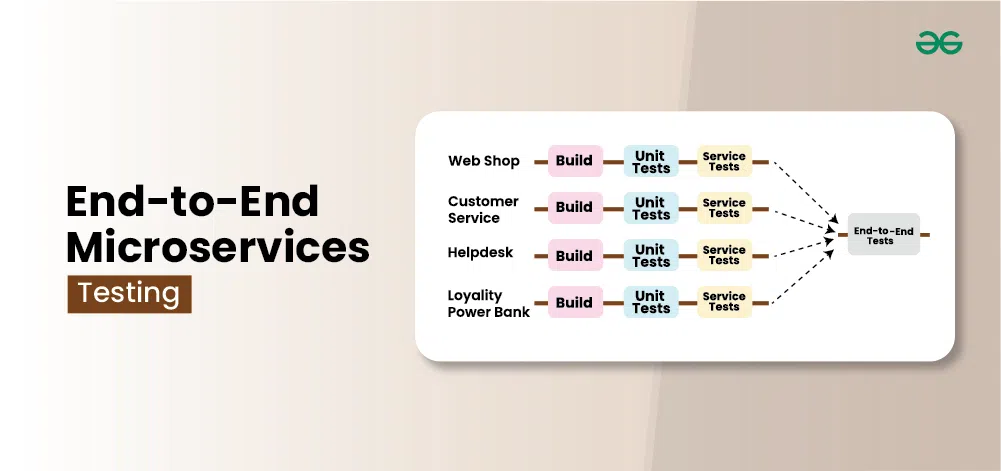
An automated end-to-end test would typically be a script (e.g., using pytest) that:
- Programmatically starts the entire environment using Docker Compose.
- Sends the HTTP request, just like our
test_client.pyscript. - Waits and polls the system to verify the expected side effects (e.g., checks the database for a new record, queries another service's API for a status update).
- Asserts that the final state of the system is correct.
- Tears down the environment.
This automates the entire "observe and verify" process we just did by hand.
Conclusion
In this lesson, you validated the architecture you have painstakingly built over this entire module. You saw firsthand how a single client request can trigger a complex but predictable workflow that spans multiple services, combining both synchronous and asynchronous communication.
Key Takeaways:
- An end-to-end flow in microservices often has a fast, synchronous phase (for user feedback) and a slower, robust, asynchronous phase (for backend processing).
- Testing this flow involves stimulating the system at its entry point (the API Gateway) and verifying the effects across all involved components: logs, message queues, and databases.
- Orchestration tools like Docker Compose are fundamental for creating a realistic, isolated, and repeatable testing environment for your entire microservices system.
Preview of the Next Lesson
Our system now works perfectly... in a perfect world. But distributed systems live in an imperfect world where networks fail and services crash. In the final lesson of this module, "Demonstrate system resilience by simulating a service failure," we will move from testing for success to testing for failure. We will intentionally shut down a critical service mid-flow and observe the consequences, setting the stage for building more resilient, fault-tolerant systems.