Hello! Welcome to the fifth lesson in our module on Cross-Platform Strategy & Budgeting.
In our last lesson, we developed a strategic framework for allocating your hotel's ad budget between Google and Meta. We established a starting point—prioritizing Google for capturing booking intent and using Meta for building brand demand—and discussed how to adjust that split based on seasonality and business goals.
Now that you have a plan for where to spend your money, we need to address the critical follow-up question: "Is my money working?" This lesson tackles the learning outcome: Select standardized KPIs to compare performance across Meta and Google. We'll move from theory to practice, identifying the specific metrics that allow you to create an "apples-to-apples" comparison between these two powerful, yet different, platforms. This skill is the foundation for making smart, data-driven decisions to scale what works and fix what doesn't.
1. The Challenge: Comparing Search and Social
Before we can compare Google and Meta, we must acknowledge why it's a challenge. They operate in fundamentally different ways:
- Google Ads captures intent. A user is actively searching for "hotel with a pool in downtown," and your ad provides a direct answer.
- Meta Ads creates demand. A user is scrolling through their feed, and your beautiful video ad inspires them to consider a future trip.
Because of this, the platforms have their own native metrics that don't always align. For example, Google has its "Quality Score," while Meta has "Relevance Diagnostics." A "click" on a Meta ad could mean someone clicked to your profile, whereas on Google it almost always means they clicked to your website.
To make informed budget decisions, we need to cut through this noise and focus on a set of standardized Key Performance Indicators (KPIs) that measure what truly matters to your hotel's bottom line.
2. Building Your Standardized KPI Toolkit
Let's build your toolkit of essential metrics, starting with a general overview and then drilling down into the specifics for cross-platform comparison.
To start, watch this video for a solid introduction to the most common metrics in digital marketing. It will help you get familiar with the terminology.
Digital Marketing Metrics & KPI's Explained (With Examples)
The video 'Digital Marketing Metrics & KPI's Explained' by Elevate Digital gives a fantastic overview of the core metrics you'll encounter. Pay attention to how it groups them into business, website, and platform metrics.
Please watch from 01:21 to 12:24. Focus on understanding the definitions of CPA, LTV, conversion rate, impressions, reach, CTR, and CPC. Don't worry about memorizing everything; the goal is to get a broad understanding.
Now, let's organize these concepts into a standardized list you can use to compare Google and Meta.
Key Standardized KPIs
| KPI Category | Metric | Definition & Why It's Important | How to Standardize |
|---|---|---|---|
| Cost | Amount Spent | The total cost of your campaigns on each platform. The most basic input for any performance analysis. | This is already standardized. |
| Awareness | Impressions | The total number of times your ad was shown. Measures raw visibility. | This is already standardized. |
| CPM (Cost Per Mille) | The average cost to show your ad 1,000 times. Measures the efficiency of your visibility. | A great top-of-funnel KPI to compare awareness campaigns across both platforms. | |
| Engagement | Link Clicks | The number of clicks that led to your website. | Crucial for standardization. In Meta, always use "Outbound clicks" or "Link clicks", not "Clicks (All)". This ensures you are comparing clicks to your site, just like in Google Ads. |
| CTR (Click-Through Rate) | The percentage of impressions that resulted in a link click. Measures how compelling your ad is. | Standardize by using the Link Clicks / Impressions formula for both platforms. |
|
| CPC (Cost Per Click) | The average cost for a single link click. Measures the efficiency of your traffic. | Standardize by using Amount Spent / Link Clicks. This gives you a true cost-of-traffic comparison. |
|
| Conversion | Conversions (Bookings) | The number of desired actions taken (e.g., a completed booking). | The most important standardization. Your definition of a "booking" must be identical in GA4, Google Ads, and Meta Ads. This is why our previous work on tracking is so vital. |
| CVR (Conversion Rate) | The percentage of link clicks that resulted in a conversion. Measures your website's effectiveness. | Conversions / Link Clicks. A key indicator of landing page and offer quality. |
|
| CPA (Cost Per Acquisition) | The average cost to acquire one conversion (e.g., Cost Per Booking). | Amount Spent / Conversions. A primary indicator of campaign profitability. |
|
| Revenue | ROAS (Return on Ad Spend) | The total revenue generated for every dollar spent on ads. | Total Conversion Value / Amount Spent. The ultimate measure of profitability for your direct booking campaigns. |
This table, which is supported by the insights in the Supermetrics article "How to analyze your paid ad performance," gives you a powerful, standardized lens through which to view your campaigns.
3. From Data to Decisions: Primary vs. Diagnostic KPIs
Having a long list of KPIs is useful, but it can also be overwhelming. The key to effective analysis is to structure them into a hierarchy. A powerful way to do this is to think in terms of Primary KPIs and Diagnostic KPIs.
This next video explains this concept clearly in the context of Meta Ads, but the principle applies universally.
How to Analyze Facebook Ads Data the Right Way (The 2026 Guide)
In 'How to Analyze Facebook Ads Data the Right Way', Dara Denney introduces the brilliant concept of 'primary' versus 'storytelling' (or diagnostic) metrics. This framework is essential for focusing your analysis.
Please watch from 02:22 to 07:02 and again from 11:42 to 13:00. Focus on the distinction she makes: Primary metrics tell you what is working, while storytelling metrics tell you why.
Let's apply this framework to your hotel:
-
Primary KPIs (The "What"): These measure direct business impact and should be the main drivers of your budget decisions.
- ROAS (Return on Ad Spend)
- CPA (Cost Per Booking)
- Number of Conversions (Bookings)
If a Google campaign has a 10x ROAS and a Meta campaign has a 5x ROAS, your primary KPIs tell you the Google campaign is performing better.
-
Diagnostic KPIs (The "Why"): These help you understand why your primary KPIs are what they are. They are for troubleshooting and optimization, not for high-level budget decisions.
- CPM
- CPC
- CTR
- CVR
Following the example above, why is the Meta campaign's ROAS lower? You would use diagnostic KPIs to investigate: Is it because the CPC is too high? Or is the Conversion Rate on the website lower for traffic coming from Meta? This structured thinking helps you pinpoint the problem area.
Test your understanding!
A Google Search campaign for "luxury hotel downtown" spent $1,000 and generated 5 bookings at an average value of $800 each. A Meta Sales campaign targeting users interested in luxury travel also spent $1,000 and generated 3 bookings at the same average value.
- What are the Primary KPIs (CPA and ROAS) for each campaign?
- Based on the Primary KPIs, which campaign is more profitable?
- You investigate the Diagnostic KPIs. The Google campaign had a CPC of $5 and a CVR of 2%. The Meta campaign had a CPC of $2 and a CVR of 0.5%. What does this tell you about why the Meta campaign was less profitable, even though it had cheaper traffic?
Show answer
-
Primary KPIs:
- Google Ads:
- CPA = $1,000 / 5 bookings = $200 per booking
- ROAS = (5 bookings * $800) / $1,000 = $4,000 / $1,000 = 4x
- Meta Ads:
- CPA = $1,000 / 3 bookings = $333 per booking
- ROAS = (3 bookings * $800) / $1,000 = $2,400 / $1,000 = 2.4x
- Google Ads:
-
The Google Ads campaign is significantly more profitable, with a lower CPA and a higher ROAS.
-
The diagnostic KPIs reveal the story. Even though Meta delivered much cheaper clicks ($2 CPC vs. Google's $5), the traffic converted at a much lower rate (0.5% CVR vs. Google's 2%). This means the traffic from Google, while more expensive, was of much higher quality and intent. The issue with the Meta campaign isn't the cost of traffic (CPC), but the quality of that traffic or the landing page's effectiveness for that audience (CVR).
4. Putting it all Together: The Cross-Platform Dashboard
The goal of standardization is to bring all this data into one place for a clear, consolidated view. This is typically done in a dashboard.
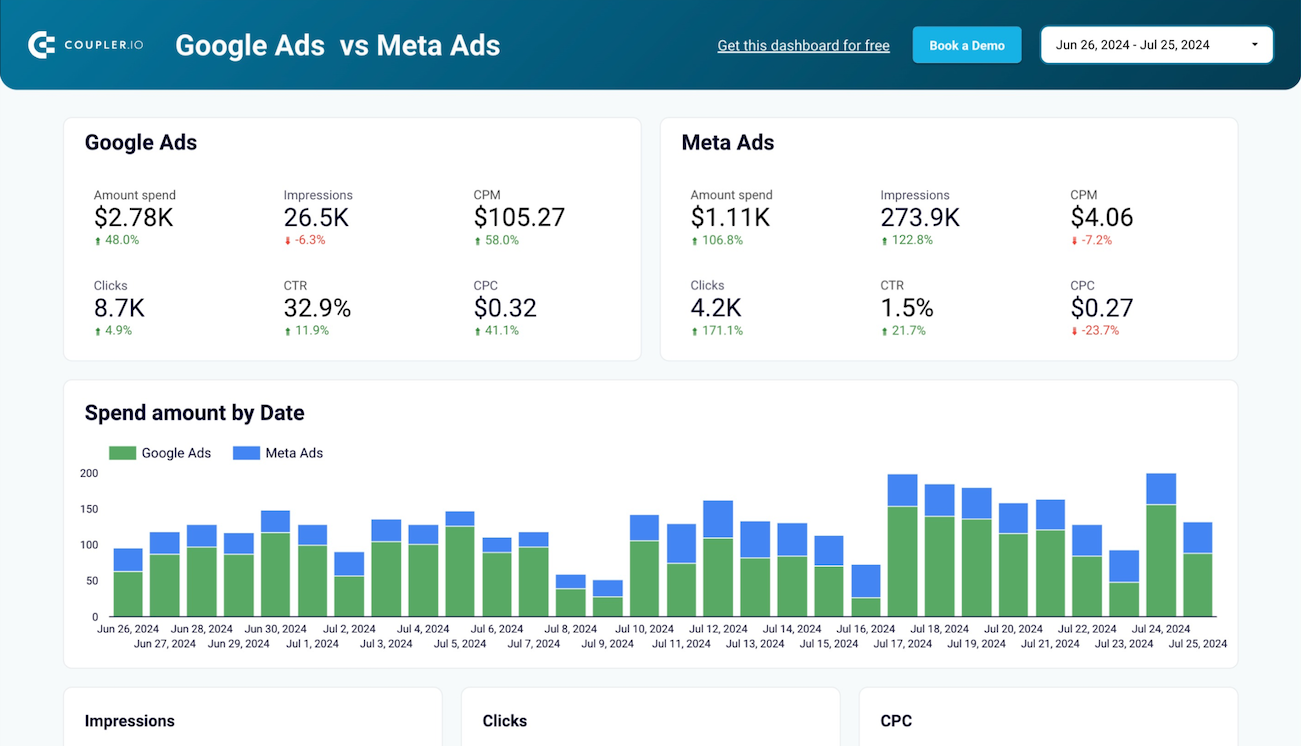
To build a simple yet powerful dashboard for your hotel, you would want to include the standardized KPIs we've discussed. The article "Booked Solid" provides a concise list of KPIs for hotels that aligns perfectly with our framework.
Booked Solid: Meta & Google Ads Campaigns That Fill Hotel ...
The article 'Booked Solid' by Propellant Media contains a very practical table summarizing the key KPIs for hotel marketing campaigns on Google and Meta.
Please scroll down to the section 'Hotel Marketing KPIs to Track in Summer Campaigns' and look at the table. Notice how it lists the most important metrics for each channel, focusing on business outcomes like ROAS and Bookings.
Your ideal dashboard would have columns for:
- Channel (Google Ads, Meta Ads)
- Campaign
- Amount Spent
- Impressions
- CPM
- Link Clicks
- CPC
- Bookings (Conversions)
- CPA (Cost per Booking)
- Booking Value (Conversion Value)
- ROAS
This view allows you to see, at a glance, which platform and which specific campaigns are driving the best results for your budget.
5. An Important Caveat: The Role of Attribution
One final, crucial element of standardization is attribution. An attribution model determines which ad gets credit for a conversion.
How to analyze your paid ad performance across multiple ...
The Supermetrics article 'How to analyze your paid ad performance across multiple channels' briefly touches on a very important concept for standardization: the attribution window.
Please read just the section titled 'Attribution window'. The key takeaway is that platforms have different default settings and that consistency is vital for accurate comparison.
By default, Meta may credit a booking to an ad if someone clicked it within 7 days, while Google Ads might use a 30-day window. If you don't align these settings, your data will be inconsistent.
We will dive deep into attribution models in Module 9. For now, the most important takeaway is this: be aware of your settings and strive for consistency wherever possible. Using a single source of truth like Google Analytics 4 to report on conversions helps create this consistency.
Conclusion
You now have a robust framework for evaluating your advertising efforts across the two most important platforms for your hotel. By focusing on standardized metrics, you can make informed, objective decisions about where to allocate your budget to maximize returns.
Key Takeaways:
- Standardize your definitions: Ensure a "click" means a link click and a "conversion" means a booking across both Google and Meta.
- Use a core set of KPIs: Focus on Spend, CPM, Link Clicks, CPC, Conversions (Bookings), CVR, CPA, and ROAS for cross-platform comparison.
- Adopt a metric hierarchy: Use Primary KPIs (ROAS, CPA) to make budget decisions and Diagnostic KPIs (CTR, CPC, CVR) to understand why performance is what it is.
- Strive for consistency: Be mindful of settings like attribution windows to ensure you're comparing apples to apples.
What's Next?
With a clear understanding of how to measure and compare performance, you're ready to act on that data. In our next and final lesson of this module, we will address the learning outcome: Evaluate when to scale successful campaigns versus reallocating budget to testing. You'll learn how to use the KPIs from today's lesson to confidently decide whether to double down on a winner or explore new opportunities.