Hello! Welcome to the fourth lesson in our CRM Analytics Foundations module.
In our last session, we explored customer segmentation, establishing how to divide your market into meaningful groups based on firmographic, demographic, and behavioral data. You saw how this is practically done in a CRM like HubSpot. Today, we will apply that skill to one of the most critical tasks in sales and marketing analytics: interpreting the sales funnel.
This lesson addresses how to interpret a sales funnel to identify conversion bottlenecks. This is a cornerstone skill for your goal of leading a pan-African market entry. When you're dealing with diverse markets, an aggregate view of your sales process can be dangerously misleading. By analyzing the funnel, you can pinpoint exactly where in the customer journey you are losing potential customers and, more importantly, why. This allows you to allocate resources effectively, refine your strategy, and improve your overall win rate.
1. The Sales Pipeline vs. The Sales Funnel
To begin, it's crucial to clarify two often-confused terms: the sales pipeline and the sales funnel. While related, they offer different perspectives on your sales process.
A sales pipeline refers to the defined stages that a prospect moves through as they progress from a lead to a customer. It's a visual representation of your sales process and where every active deal currently sits. Think of it as a roadmap for your sales team.
A sales funnel, on the other hand, measures the efficiency of that pipeline. It shows the volume of prospects at each stage and, critically, the conversion rates between stages. It answers the question: "Of all the prospects that entered a stage, what percentage moved to the next?"
The short video below provides a clear, concise explanation of this distinction.
What's the Difference Between a Sales Pipeline and a Sales Funnel? | In a Nutshell
This video from Nutshell clearly explains the difference between a sales pipeline and a sales funnel.
Please watch the segment from the definition of a funnel, which explains how it measures quantity and conversion rates. Pay close attention to the final summary from pipeline vs. funnel, which provides a perfect one-sentence distinction between the two concepts.
As the video highlights, the pipeline represents the stages, while the funnel measures the effectiveness of those stages. It's by measuring this effectiveness that we can identify bottlenecks.
2. The Anatomy of a Sales Funnel
A sales funnel visualizes the customer journey, typically getting narrower from top to bottom as prospects are qualified out or decide not to purchase. The goal of funnel analysis is to understand the shape of your funnel and identify where the narrowing is happening too steeply.

This diagram illustrates the "AARRR" (Pirate Metrics) funnel, a popular framework. Note how it explicitly shows the number of users at each stage and calculates the conversion rates between them, highlighting a "main bottleneck" where the drop-off is most significant.
The image above shows a conceptual funnel. You can see the initial 100,000 users in the "Awareness" stage are reduced to just 500 by the "Revenue" stage. The key to analysis is not just that the numbers decrease, but where and by how much. The dramatic drop from 5,000 "Activated" users to 500 "Revenue" users (a 10% conversion rate) is identified as the main bottleneck. This is precisely the kind of insight you are looking for.
Now, let's see what this looks like in practice inside a CRM.
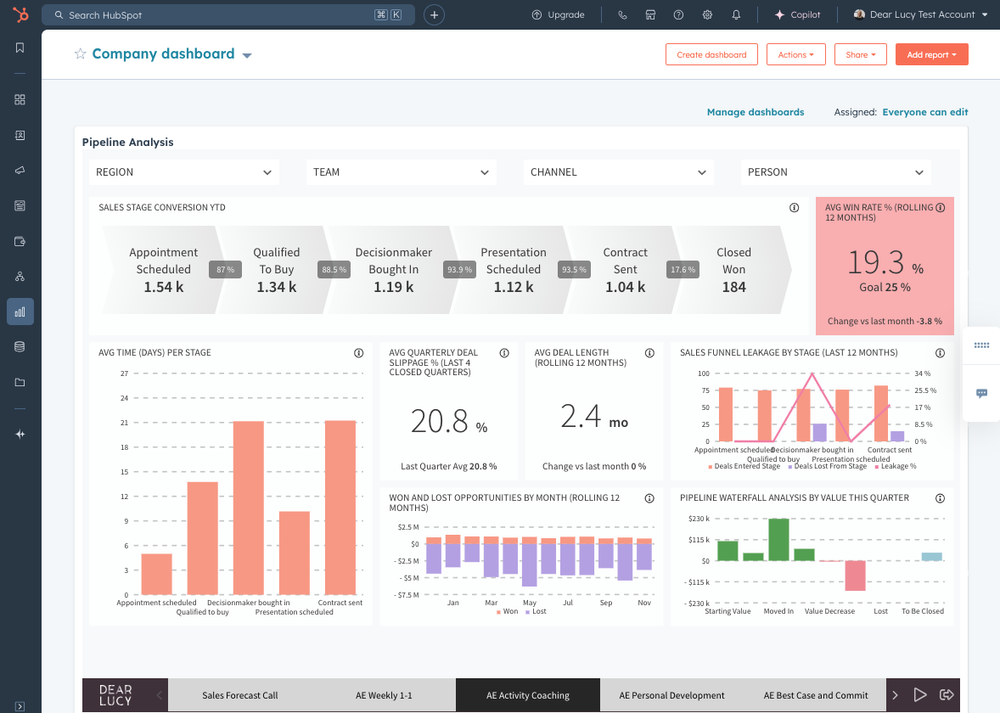
This HubSpot dashboard provides a real-world example of funnel analysis. The "Sales Stage Conversion YTD" component at the top shows a deal-based funnel with conversion percentages between each stage, from "Appointment Scheduled" to "Closed Won".
This dashboard view is the output of the analysis we're learning to perform. It immediately tells you the conversion rate from Qualified to Buy to Decisionmaker Bought in is 88.5%, while the final conversion from Contract Sent to Closed Won is a much lower 17.6%. This is a classic funnel report, and that 17.6% might be a bottleneck worth investigating.
3. Reading a Funnel Report to Find Bottlenecks
Now that we've seen what funnels look like, let's explore how to build and interpret them within HubSpot. The process involves defining your stages, counting the volume at each stage, and calculating the conversion rates.
The following guide from Hublead provides a comprehensive walkthrough. We'll focus on the core concepts of reading and interpreting the report.
HubSpot funnel report: the complete guide
This article is a practical guide to building and using funnel reports in HubSpot. It explains how to identify bottlenecks and act on your findings.
First, read the section What is a HubSpot funnel report? to solidify your understanding of its components. Next, jump to the section "How to read a HubSpot funnel report" and read the subsections on The bar chart and Conversion rates. Most importantly, focus on the subsection Drop-off analysis. This part is key: the goal is not just to see percentages, but to understand the absolute number of lost opportunities and their potential revenue impact.
The key takeaway from the reading is that your primary task is to look for dramatic drops. A funnel will always narrow, but a sudden, steep drop-off between two stages is a red flag. This is your bottleneck. For example, if you convert 80% of leads from "Appointment Scheduled" to "Appointment Completed," but only 15% from "Appointment Completed" to "Proposal Sent," you have found a critical bottleneck to investigate.
4. Diagnosing Bottlenecks with Segmentation
Identifying a bottleneck is the first step. The second, more important step is diagnosing why it's happening. An aggregate funnel report, like the ones we've seen so far, tells you the "what" but not the "why."
Is the low conversion from "Contract Sent" to "Closed Won" a universal problem, or is it specific to a certain region, industry, or sales representative? This is where our previous lesson on segmentation becomes indispensable.
By applying segmentation to your funnel analysis, you can move from a general observation to a specific, actionable insight.
HubSpot funnel report: the complete guide
Continuing with the same guide, we will now focus on how to use segmentation to diagnose the root cause of a bottleneck.
Please read the section How to break down a funnel report by property. This explains the powerful technique of segmenting your funnel directly within the report. Then, read the section What to do with your funnel data. This provides a diagnostic framework for common bottlenecks at different parts of the funnel.
This is where your analytical skills come into play. When you enter a new African market, you might create a funnel report and see a major drop-off after the "Demo Completed" stage. By breaking down the funnel by the "Country" property, you might discover that this drop-off is almost entirely driven by leads from Nigeria, while leads from Kenya are converting smoothly. This insight allows you to stop looking for a universal problem and start investigating a specific one: Why are our demos failing to resonate with Nigerian prospects? Is it a product-market fit issue? A communication style mismatch? A pricing concern specific to that market?
This level of segmented analysis is the difference between generic sales management and strategic, data-driven market entry.
5. Time: The Hidden Bottleneck
Finally, remember that bottlenecks aren't just about how many deals you lose; they're also about how long it takes to move deals forward. A stage where deals stall for weeks or months is also a bottleneck, even if the conversion rate is acceptable. This slows down your entire sales cycle and ties up your team's resources.
A metric called Pipeline Velocity measures the speed at which revenue moves through your pipeline. While we will cover this in more detail in a later module, it's useful to be aware of its components now.
Mastering Your HubSpot Sales Pipeline: A Step‑by‑Step Guide | Vested
This article on mastering the HubSpot sales pipeline introduces a key metric for understanding the speed of your sales process.
Find the heading Measure & Accelerate Your Pipeline Velocity. Read this section to understand the formula for pipeline velocity and its four components: number of deals, win rate, average deal size, and sales cycle length.
The key insight is that a long Sales Cycle Length directly reduces your pipeline velocity. Looking back at the HubSpot dashboard image, you'll notice the "Avg Time (Days) Per Stage" report. If you see that deals are spending an unusually long time in one particular stage, that's another type of bottleneck that requires investigation.
Conclusion
In this lesson, we've moved from understanding what a sales funnel is to using it as a powerful diagnostic tool. You've learned how to identify and interpret conversion bottlenecks, which is a critical skill for optimizing your sales process and executing a successful market entry strategy.
Here are the key takeaways:
- A pipeline shows your sales stages; a funnel measures the conversion efficiency between them.
- Bottlenecks are stages with a significant drop in conversion rate or an excessively long time-in-stage.
- The most effective funnel analysis involves segmentation. Breaking down your funnel by properties like country, industry, or lead source helps you uncover the true root cause of a bottleneck.
- Interpreting a funnel is about forming a hypothesis (e.g., "Our MQL-to-SQL conversion is low because marketing is sending unqualified leads") and then using data to validate or reject it.
In our next lesson, we will shift our focus from the acquisition process to the outcome. We'll learn how to calculate Customer Lifetime Value (CLV). This will allow you to answer a crucial question: What is the long-term financial worth of the customers you are successfully guiding through the funnel? This perspective is essential for making strategic decisions about which market segments are the most valuable to pursue.