Introduction
Welcome to your second lesson! In our first session, we installed Power BI Desktop and became familiar with its three main views: Report, Data, and Model. You'll have noticed that these views were empty. Today, we'll change that by bringing in some data.
This lesson directly addresses your goal of understanding the end-to-end Power BI workflow by starting at the very beginning: data connection. We will focus on connecting to and importing data from two of the most common sources you'll encounter: Excel workbooks and CSV files. Given your deep experience with Excel, this first step should feel very intuitive. By the end of this lesson, you will have successfully loaded data into Power BI, ready for the next stages of analysis.
Part 1: Connecting to an Excel Workbook
Power BI is designed to work seamlessly with Excel. The process begins in the Home tab of the ribbon, using the Get Data button.

When you connect to an Excel file, Power BI presents you with a "Navigator" window. This window lets you see all the available sheets and any formally defined Tables within the workbook.
A quick tip based on your Excel background: It is always a best practice to connect to a Table rather than a worksheet. Tables have a defined structure (headers and a specific data range), which leads to a much cleaner and more reliable import process, preventing stray cells or notes on a worksheet from being accidentally imported.
After selecting your data, you will see two main options:
- Load: This brings the data directly into your Power BI data model as-is.
- Transform Data: This opens the Power Query Editor, where you can clean and reshape your data before loading it. We will explore Power Query in detail in the next module.
For a clear demonstration of this process, the following video is an excellent guide.
Power BI Tutorial For Beginners | Create Your First Dashboard Now (Practice Files included)
In this segment from Leila Gharani's "Power BI Tutorial For Beginners", you'll see a walkthrough of connecting to both an Excel file and a CSV file. We'll watch the part about Excel first.
Watch the clip from 05:17 to 06:17. Focus on how the Excel file is selected and how the Navigator window is used to choose a table ('Tbl_Customer') rather than the sheet.
Part 2: Connecting to a CSV File
CSV (Comma-Separated Values) files are another extremely common data source. They are simple text files that use a delimiter (usually a comma) to separate values. The process for connecting to a CSV is almost identical to connecting to an Excel file.
You'll start from the Get Data menu again, but this time you will select the Text/CSV option.
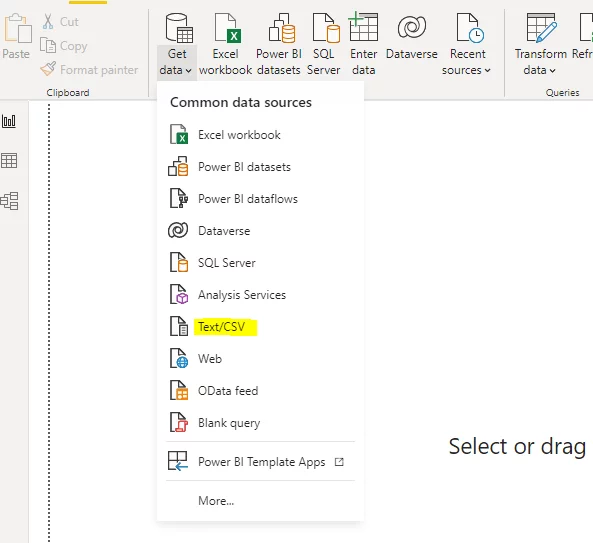
Once you select a CSV file, Power BI will show you a preview of the data. It automatically tries to detect the delimiter and data types, but this preview window gives you a chance to verify that everything looks correct before proceeding.
Let's return to the video to see this in action.
Power BI Tutorial For Beginners | Create Your First Dashboard Now (Practice Files included)
Now, let's watch the part of the same video that demonstrates connecting to a CSV file.
Watch the clip from 01:54 to 02:39. Notice how Power BI shows a preview of the CSV file's contents before you decide to load or transform it.
Part 3: Hands-On Practice
Now it's your turn to get data into Power BI. We'll use the same types of files shown in the video. The resource below provides excellent, illustrated step-by-step instructions that you can follow. It uses its own sample files, which you can download if you wish, or you can use any simple Excel and CSV files you have on hand.
[PDF] Power BI for Intermediates
This PDF guide, 'Power BI for Intermediates', has clear, illustrated sections on connecting to data. We'll use it as a reference for our hands-on activity.
Refer to section '2.3 Importing Data', specifically the subsections that guide you through importing a CSV file (starting on page 10) and an Excel file (starting on page 12). Use these detailed steps to guide you through the exercise below.
Please follow these steps in Power BI Desktop:
Activity 1: Import from a CSV file
- Open Power BI Desktop.
- On the
Hometab, clickGet Data. - Select
Text/CSV. - Browse to and select a CSV file. Let's imagine this is a file of F1 race results for a season.
- In the preview window, review the data and click Load.
Activity 2: Import from an Excel file
- Again, on the
Hometab, clickGet Data. - Select
Excel workbook. - Browse to and select an Excel file. Imagine this file contains financial data, like a table of F1 team budgets.
- In the Navigator window, find a table (indicated by a blue-topped icon) and check the box next to it.
- Click Load.
Verification Step:
Once you have loaded both files, take a look at the Power BI interface:
- In the Fields pane on the right, you should now see your two tables listed. You can click the arrow next to each table name to see the column headers.
- Click on the Data view icon (the grid symbol on the left). Here, you can select each table from the Fields pane and see the raw data you've just imported, just like looking at a spreadsheet.
This confirms you have successfully connected to and imported your data!
Conclusion
Excellent work! You have just completed a fundamental step in any Power BI project. You are no longer looking at an empty canvas; you now have the raw materials for your analysis loaded and ready.
Key Takeaways:
- You can connect to data using the Get Data button on the
Homeribbon. - You've learned how to import data from the two most common business data sources: Excel workbooks and CSV files.
- You understand the best practice of connecting to formal Tables within Excel for more reliable imports.
- After loading, you can verify your data in the Data view and see your tables in the Fields pane.
Preview of the Next Lesson:
In this lesson, we used the Load option to bring the data in directly. However, data is rarely perfect. In our next lesson, we will explore the Transform Data option and dive into the powerful Power Query Editor. This is where we will start cleaning and preparing our data for analysis, a critical step in building a robust and accurate report.