Welcome to your fifth lesson. In our last session, we explored how to use learning curves to diagnose whether a model is suffering from high bias (underfitting) or high variance (overfitting). You learned that these diagnostic plots provide a clear, visual guide for deciding whether to increase model complexity, gather more data, or adjust features.
However, the learning curves we generated relied on a single, random split of the data into training and validation sets. This raises a critical question from an architectural standpoint: how reliable is that single evaluation? If we re-shuffled the data, would we get the same result? A production system cannot be built on a "lucky" split.
This lesson tackles that exact problem. We will focus on designing a robust model validation strategy using k-fold cross-validation. You will learn not just what k-fold cross-validation is, but how to use it to generate a reliable estimate of your model's performance and stability. This technique is a cornerstone of professional machine learning, ensuring the results you see in development are a trustworthy reflection of what you can expect in production.
The Fragility of a Single Split
Most introductory tutorials begin with a simple train_test_split. While easy to understand, this approach has a critical flaw: the performance metric you obtain is highly dependent on which specific data points happened to land in the training set versus the test set. For small or moderately sized datasets, this sampling variance can be huge, giving you a misleading sense of either failure or success.
To see just how dramatic this effect can be, let's watch a segment from a video that frames this problem from an architect's perspective.
Your Accuracy Is a Lie — Here's How to Fix It (The Architect's Guide to Robust Model Validation)
This video, "Your Accuracy Is a Lie," directly addresses the unreliability of a single train-test split and introduces k-fold cross-validation as the professional solution.
Please watch the first part of the video, from the introduction. Pay close attention to the visualization of accuracy scores bouncing around with different random shuffles. The key takeaway is understanding why any single score is not trustworthy and how k-fold cross-validation provides a more stable estimate by averaging across multiple splits.
As the video demonstrates, relying on a single split is like rolling a die once and declaring it representative. The solution is to roll the die multiple times and average the results. This is the core intuition behind k-fold cross-validation.
K-Fold Cross-Validation: The Professional Standard
K-fold cross-validation formalizes the idea of "averaging multiple splits" into a systematic and robust procedure. It provides a more accurate estimate of a model's generalization performance and, just as importantly, an estimate of its stability.
The process is as follows:
- The training data is partitioned into k equal-sized, non-overlapping subsets, called "folds". A common choice for k is 5 or 10.
- The process iterates k times. In each iteration:
- One fold is held out as a temporary validation set.
- The remaining k-1 folds are used as the training set.
- The model is trained on the training set and evaluated on the validation set.
- The final performance metric is the average of the scores from the k iterations.
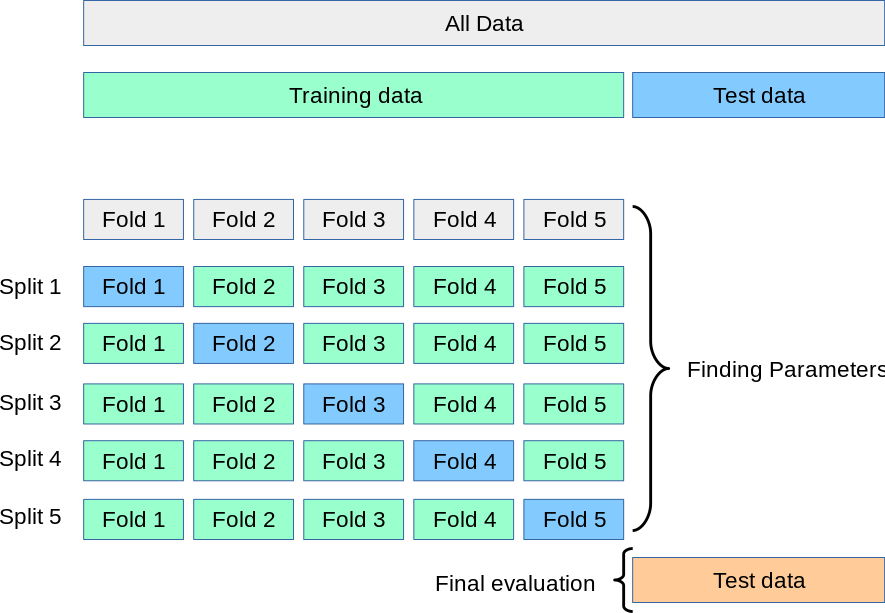
Let's ground this concept with the official scikit-learn documentation, which also provides the practical code for implementation.
3.1. Cross-validation: evaluating estimator performance
This scikit-learn documentation is the canonical reference for cross-validation. It explains the problem, defines the solution, and shows you how to implement it.
Please read the following sections: The introductory text, from the beginning down to the start of the k-fold definition. This recaps the problem we've just discussed. The short definition of k-fold, starting from "A solution to this problem". The section on "Computing cross-validated metrics", from "Computing cross-validated metrics". Focus on the cross_val_score function and how it returns an array of scores, one for each fold.
The most important output from cross_val_score is not just the mean score, but also the standard deviation. As the video highlighted, a model that scores 88% ± 1% is far more reliable and production-ready than a model that scores 91% ± 8%. The low standard deviation tells you that the model's performance is stable and not dependent on a specific data split, which is exactly what an architect needs: predictability.
Designing Your Validation Strategy: One Size Does Not Fit All
While k-fold is the right general approach, a robust validation strategy requires choosing the correct type of k-fold for your specific problem. Using the wrong type can lead to misleading results just as surely as using a single split. From your perspective as an architect, selecting the right validation scheme is a crucial design decision.
Case 1: Classification with Imbalanced Classes
Imagine a fraud detection problem where only 1% of transactions are fraudulent. If you use standard KFold, random chance might place all the fraud cases in a few folds, leaving others with none. The model would score perfectly on those "no-fraud" folds by simply predicting "not fraud" every time, artificially inflating the average score.
The Solution: StratifiedKFold
Stratified k-fold ensures that each fold's class distribution is representative of the whole dataset. If your data has 99% Class A and 1% Class B, each fold will also have a 99%/1% split.
This is the default for most classification tasks. In fact, scikit-learn's cross_val_score automatically uses StratifiedKFold if you pass it a classifier.
3.1. Cross-validation: evaluating estimator performance
The scikit-learn documentation explains the problem of imbalanced classes and the stratified solution.
Read the introduction to stratification and the detailed section on Stratified K-fold. The code example comparing StratifiedKFold to KFold on an unbalanced dataset is particularly illustrative.
Case 2: Grouped or Clustered Data
Consider a medical dataset where you have multiple sensor readings from the same patient. These rows are not independent. If you use a standard k-fold split, some readings from Patient A could be in the training set while others from the same patient are in the validation set. The model might learn to recognize Patient A's specific physiology rather than the general disease pattern. This is a form of data leakage.
The Solution: GroupKFold
Group k-fold ensures that all data points from a single group (e.g., a specific patient ID) are assigned to the same fold, either entirely in the training set or entirely in the validation set for a given split. This guarantees the model is always evaluated on groups it has never seen before.
3.1. Cross-validation: evaluating estimator performance
This section of the documentation covers the critical case of non-independent data.
Read the introduction to grouped data and the section on Group K-fold. This is a common pitfall in real-world projects, and understanding this strategy is a sign of a mature practitioner.
Case 3: Time Series Data
When your data has a time component (e.g., daily sales, stock prices), the rows are ordered chronologically. Shuffling this data is forbidden because it would allow the model to "peek into the future" to predict the past, a form of leakage called "causality violation".
The Solution: TimeSeriesSplit
This method creates folds that respect the arrow of time. The training set always consists of data that occurred before the validation set. In each successive split, the training window expands to include more past data.
3.1. Cross-validation: evaluating estimator performance
This section addresses the unique requirements of time-ordered data.
Read the short introduction to time series CV and the following section on Time Series Split.
The Architect's Nightmare: Data Leakage in Preprocessing
We have one final, crucial topic to cover. It's the most subtle and, for that reason, the most dangerous error in a validation workflow. Even if you choose the perfect CV iterator, you can still get deceptively optimistic results if you are not careful about preprocessing.
The problem arises when preprocessing steps like scaling (StandardScaler), imputation (SimpleImputer), or dimensionality reduction (PCA) are fitted on the entire dataset before cross-validation begins. These transformers have a .fit() method; they learn parameters from the data (e.g., the mean and standard deviation for a scaler). If you fit them on the full dataset, the parameters they learn are influenced by the data in the validation folds. Information from the validation set has "leaked" into your training pipeline.
The Solution: scikit-learn Pipeline
The correct approach is to include preprocessing steps inside a Pipeline along with your model. When you pass this pipeline to cross_val_score, scikit-learn is smart enough to re-fit the preprocessing steps on only the training data for each fold. This creates a "firewall" that prevents any information from the validation fold from influencing the training process.
The same video we started with has an outstanding explanation of this exact problem and its solution.
Your Accuracy Is a Lie — Here's How to Fix It (The Architect's Guide to Robust Model Validation)
This section of "Your Accuracy Is a Lie" addresses the critical issue of data leakage through preprocessing.
Please watch the segment from "Now, we arrive at the part...". This explains why fitting scalers or PCA before cross-validation is wrong and demonstrates how using a Pipeline solves the problem at an architectural level.
Conclusion
In this lesson, we have moved from a fragile, single-split validation to a robust, professional framework. From an architect's perspective, this isn't just about getting a more accurate score; it's about risk management and building predictable systems.
Here are the key principles for your validation strategy toolkit:
- Never trust a single
train_test_splitfor performance evaluation. The results are too sensitive to the random shuffle. - Use k-fold cross-validation to get a reliable estimate of model performance. The mean of the fold scores gives you the expected performance, and the standard deviation tells you about its stability.
- Design your strategy based on your data's structure. Use
StratifiedKFoldfor classification,GroupKFoldfor clustered data, andTimeSeriesSplitfor time-ordered data. - Prevent data leakage by encapsulating preprocessing and modeling within a
scikit-learnPipeline. Any step that learns from the data (.fit()) must be part of the cross-validated pipeline.
You now have the tools to design a validation strategy that will give you genuine confidence in your model's capabilities before it ever sees production data. In our next lesson, we will put this all together and build a complete, reproducible data processing and modeling workflow using scikit-learn Pipelines and ColumnTransformers, further cementing these foundational practices.