Hello! Welcome back to our course on embedded driver development.
In our last lesson, we discussed the critical patterns for communicating between Interrupt Service Routines (ISRs) and RTOS tasks. We covered the constraints of interrupt context, the use of ...FromISR API variants, and the importance of interrupt priority management with configMAX_SYSCALL_INTERRUPT_PRIORITY. These are the theoretical foundations of robust interrupt handling.
Today, we bring that theory to life. This lesson addresses the learning outcome: Analyze RTOS behavior, including task states, context switches, and timing, using debugger trace features. We'll explore how modern debuggers provide a "flight recorder" for your RTOS, allowing you to visualize its behavior, measure performance, and diagnose complex bugs that are invisible to traditional debugging methods. Mastering these tools is a key differentiator for senior embedded engineers.
1. Beyond Breakpoints: The Need for System Tracing
Your experience with debuggers like Lauterbach has surely shown you the power of breakpoints for examining system state at a specific moment. However, when debugging an RTOS, this approach has two major drawbacks:
- Invasive: Halting the system at a breakpoint completely disrupts its real-time behavior. Timing-sensitive interactions between tasks, ISRs, and peripherals are destroyed, often causing the bug you're hunting to disappear.
- Lacks History: A breakpoint only shows you a single snapshot in time. It doesn't tell you the sequence of events that led to that state. Why is this task running? What preempted the other task?
This is why traditional debugging is often compared to guesswork in real-time systems. We need a more scientific approach.
Mastering RTOS Debugging Techniques
To start, let's watch a segment from the 'Mastering RTOS Debugging Techniques' webinar by Jacob Beningo. It clearly articulates the challenges of RTOS debugging and introduces the concept of non-invasive tracing.
Watch the video from 01:04 to 07:06, and then from 14:15 to 17:05. Focus on the distinction between 'invasive' debugging (like breakpoints) and 'non-invasive' trace-based debugging, and why the latter is essential for analyzing real-time systems.
2. How RTOS Tracing Works
Non-invasive tracing allows us to record the history of the system's execution without significantly disturbing it. This is typically achieved through a combination of software and hardware:
- RTOS Instrumentation: The RTOS kernel is "instrumented" with lightweight code. At key points (e.g., a task switch, a semaphore give, an ISR entry/exit), this code writes a small event packet containing an ID and a timestamp into a RAM buffer.
- Trace Data Extraction: A debugger probe (like a J-Link or Lauterbach's TRACE32) extracts this data from the RAM buffer. Modern ARM Cortex-M processors facilitate this with dedicated hardware like the Instrumentation Trace Macrocell (ITM) and the Serial Wire Output (SWO) pin, which allow trace data to be streamed off the chip in real time with minimal CPU intervention.
- Visualization: A host-side application (like Percepio Tracealyzer, Segger SystemView, or the TRACE32 GUI) parses the stream of events and reconstructs a visual timeline of the system's behavior.
Your experience with Lauterbach JTAG debuggers puts you in a great position to leverage these advanced capabilities, as these tools are designed for exactly this kind of in-depth analysis.
3. Visualizing System Behavior: The Trace Timeline
The most powerful output of a trace tool is the timeline view. It's a Gantt chart showing which task or ISR is executing on the CPU at any given moment.
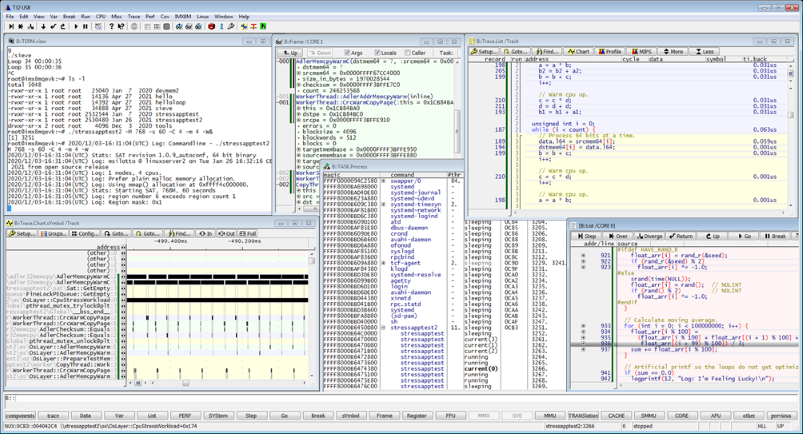
By examining this timeline, you can directly observe core RTOS concepts:
- Task States: You can see when a task is Running (green bar on the timeline), Ready (indicated by an event marker but another task is running), or Blocked (not running, waiting for an event like a semaphore or queue message).
- Context Switches: Every transition from one task to another is a context switch. You can see precisely when and why it happened.
- Preemption: You can see a low-priority task being interrupted mid-execution by a higher-priority task that just became ready.
- ISR Execution: Interrupts appear as distinct, high-priority events that preempt tasks.

Mastering RTOS Debugging Techniques
Let's see this in action. The following clip from 'Mastering RTOS Debugging Techniques' demonstrates how to set up an event recorder and analyze the resulting trace, focusing on the timeline and statistical views.
Watch from 30:08 to 49:13. Pay close attention to: How individual tasks are represented on the timeline. How to zoom in to see the sequence of events (e.g., task runs, gets semaphore, blocks). The statistical views, such as execution time (min/max/avg) and CPU load.
4. Diagnosing Common RTOS Bugs with Trace Data
The true power of tracing lies in diagnosing complex, intermittent bugs that are nearly impossible to find with breakpoints.
Mastering RTOS Debugging Techniques
This next segment is crucial for interview preparation. It shows the distinct visual 'signatures' of common RTOS problems as they appear in a trace.
Watch from 18:09 to 30:08. Focus on the visual patterns for: Thread Starvation: A low-priority task that is ready to run but is continuously preempted. Deadlock: Two tasks are permanently blocked, each waiting for a resource the other holds. Priority Inversion: A high-priority task is blocked, waiting for a low-priority task which is itself preempted by a medium-priority task.
Understanding these visual patterns allows you to move from "my system occasionally hangs" to "I can see a classic priority inversion between Task A and Task C over Mutex B, starting at timestamp 1.342s". This level of precision is exactly what's expected in a senior role.
Test your understanding!
You are analyzing a trace of a system with three tasks: Task_High (priority 3), Task_Med (priority 2), and Task_Low (priority 1). Task_High and Task_Low share a mutex.
You observe the following pattern in the timeline:
Task_Lowstarts running and acquires the mutex.Task_Highbecomes ready (e.g., its delay timer expires) and preemptsTask_Low.Task_Highattempts to acquire the mutex and blocks.Task_Lowresumes, but is immediately preempted byTask_Med, which runs for a long time.Task_Medfinishes,Task_Lowfinally runs, releases the mutex, and is then preempted byTask_High.
What RTOS problem does this pattern represent? And what is the standard solution for it?
Show answer
This is a classic priority inversion. The high-priority task (Task_High) is effectively being delayed by a medium-priority task (Task_Med) that doesn't even share the same resource.
The standard solution is to use a mutex with priority inheritance. With this mechanism, when Task_High blocks on the mutex held by Task_Low, the RTOS would temporarily boost the priority of Task_Low to be equal to Task_High's priority. This would prevent Task_Med from preempting it, allowing Task_Low to finish its critical section quickly, release the mutex, and unblock Task_High.
5. Your Toolkit: RTOS Analysis with Lauterbach TRACE32
The concepts we've seen in the videos are tool-agnostic. Since you have experience with Lauterbach, let's map these concepts to the TRACE32 environment. TRACE32's OS Awareness feature allows the debugger to understand FreeRTOS kernel objects and provide powerful analysis capabilities.
The 'OS Awareness Manual for FreeRTOS' from Lauterbach details the specific commands for this kind of analysis. We will briefly review some key features.
Skim through the following sections to see how the concepts we've discussed are implemented in TRACE32: 'Display of Kernel Resources' (Section 2.1): This describes commands like TASK.Queue and TASK.Semaphore to inspect the state of kernel objects, even while the target is running. 'Task-Related Breakpoints' (Section 2.3): Learn about the /TASK option for Break.Set. This is invaluable for debugging code shared by multiple tasks. 'Task Runtime Statistics' (Section 2.6): This explains commands like Trace.STATistic.TASK and Trace.Chart.TASK, which generate the statistical reports and timeline views we saw in the videos. 'Task State Analysis' (Section 2.7): This covers Trace.Chart.TASKState, which can create a chart showing how much time each task spends in the Running, Ready, or Blocked states.
By combining these commands, you can perform extremely detailed analysis. For example, you could use Trace.Chart.TASK to spot a timing anomaly, then use Trace.Chart.TASKState to see if the task was unexpectedly blocked, and finally use TASK.Queue to check if the queue it was waiting on was empty. This systematic approach is key to efficient debugging.
6. Interview Preparation: Key Questions
-
Question: "You're debugging a sporadic issue where a motor controller task misses its deadline. You suspect a race condition or an unexpected preemption. How would you use a tool like TRACE32 to diagnose this without using breakpoints?"
- Your Answer: "I would configure TRACE32 to capture a trace of the system running, focusing on OS events. First, I'd use the
Trace.Chart.TASKtimeline view to visually inspect the execution flow around the time of the missed deadline. I'd look for the motor controller task being unexpectedly preempted by a higher-priority task or an ISR. I would also analyze theTrace.STATistic.TASKreport to check the worst-case execution time and response time of my task; a high value could indicate a problem. If it was blocked, I'd use the Task State chart (Trace.Chart.TASKState) and the kernel resource views (TASK.Semaphore,TASK.Queue) to find out exactly what resource it was waiting for and which other task was holding it."
- Your Answer: "I would configure TRACE32 to capture a trace of the system running, focusing on OS events. First, I'd use the
-
Question: "What is the difference between instruction tracing (like ETM) and event tracing (like from SystemView or RTOS awareness), and when would you use each?"
- Your Answer: "Event tracing records high-level RTOS activities like task switches, semaphore operations, and ISR entries. It's excellent for understanding the system's dynamic behavior and debugging timing or interaction issues. Instruction tracing, on the other hand, records every single instruction executed by the CPU. It provides the ultimate level of detail and is essential for tasks like code coverage analysis for safety certification (like ISO 26262), or for debugging extremely low-level bugs like a corrupted stack pointer or a hard fault where the exact instruction sequence leading to the fault is needed."
-
Question: "What is stack analysis, and how can a debugger help with it?"
- Your Answer: "Stack analysis is the process of determining the maximum stack depth used by each task to prevent stack overflows while also not wasting RAM by overallocating. A debugger with OS awareness can help with this dynamically. For example, in TRACE32, the
TASK.STacKcommand can analyze the stack watermark for each task after the system has been running under heavy load. This shows the actual worst-case usage, which is far more accurate than static analysis, especially in complex systems with deep call chains or recursion."
- Your Answer: "Stack analysis is the process of determining the maximum stack depth used by each task to prevent stack overflows while also not wasting RAM by overallocating. A debugger with OS awareness can help with this dynamically. For example, in TRACE32, the
Conclusion
Congratulations on completing this lesson. You can now connect the theoretical behavior of an RTOS to the concrete, measurable data provided by modern trace tools. This ability to see what your system is actually doing over time is arguably the most critical skill for debugging complex embedded systems.
Key Takeaways:
- Non-invasive tracing is essential for analyzing real-time systems without disrupting their behavior.
- Trace tools visualize RTOS activity, including task states, context switches, preemption, and ISRs on a timeline.
- Common, complex bugs like priority inversion, deadlock, and task starvation have distinct visual signatures in a trace.
- Tools like Lauterbach TRACE32 provide powerful OS-aware features to inspect kernel objects, analyze task states, and measure runtime performance.
Next Lesson Preview:
We have now concluded our deep dive into RTOS concepts. In the next module, we will shift our focus to Advanced System Optimization. Our first lesson will cover the architecture of a Direct Memory Access (DMA) controller. You'll learn how to use DMA to perform peripheral-to-memory transfers, offloading the CPU and working in synergy with the RTOS to build highly efficient, high-throughput systems.