Hello! Welcome back to our course on preparing for the AZ-204 certification.
Introduction
In our last lesson, you did an excellent job configuring your App Service to read settings from the Azure environment, separating configuration from code. This is a crucial step towards building professional, production-ready applications.
However, once an application is running, how do we know what's happening inside it? How do we diagnose problems when they inevitably occur? This is where logging comes in.
Today's lesson addresses the learning outcome: Enable and configure diagnostic logging to troubleshoot an App Service application. We will explore the different types of logs Azure provides for App Service, how to enable them, and how to access them to diagnose application behavior. Your experience with C# and the .NET logging framework will be very helpful here, as we'll see how it integrates directly with Azure's capabilities.
We'll cover:
- The different categories of logs available in App Service.
- Configuring basic application logging to the filesystem and Azure Blob Storage.
- Streaming logs in real-time for live troubleshooting.
- An introduction to Application Insights, Azure's advanced Application Performance Management (APM) service.
By the end of this lesson, you'll be equipped with the fundamental skills to monitor and troubleshoot your deployed applications.
Understanding Diagnostic Log Types
Azure App Service provides several distinct types of logs, each serving a different purpose. Understanding these categories is the first step to effective troubleshooting.
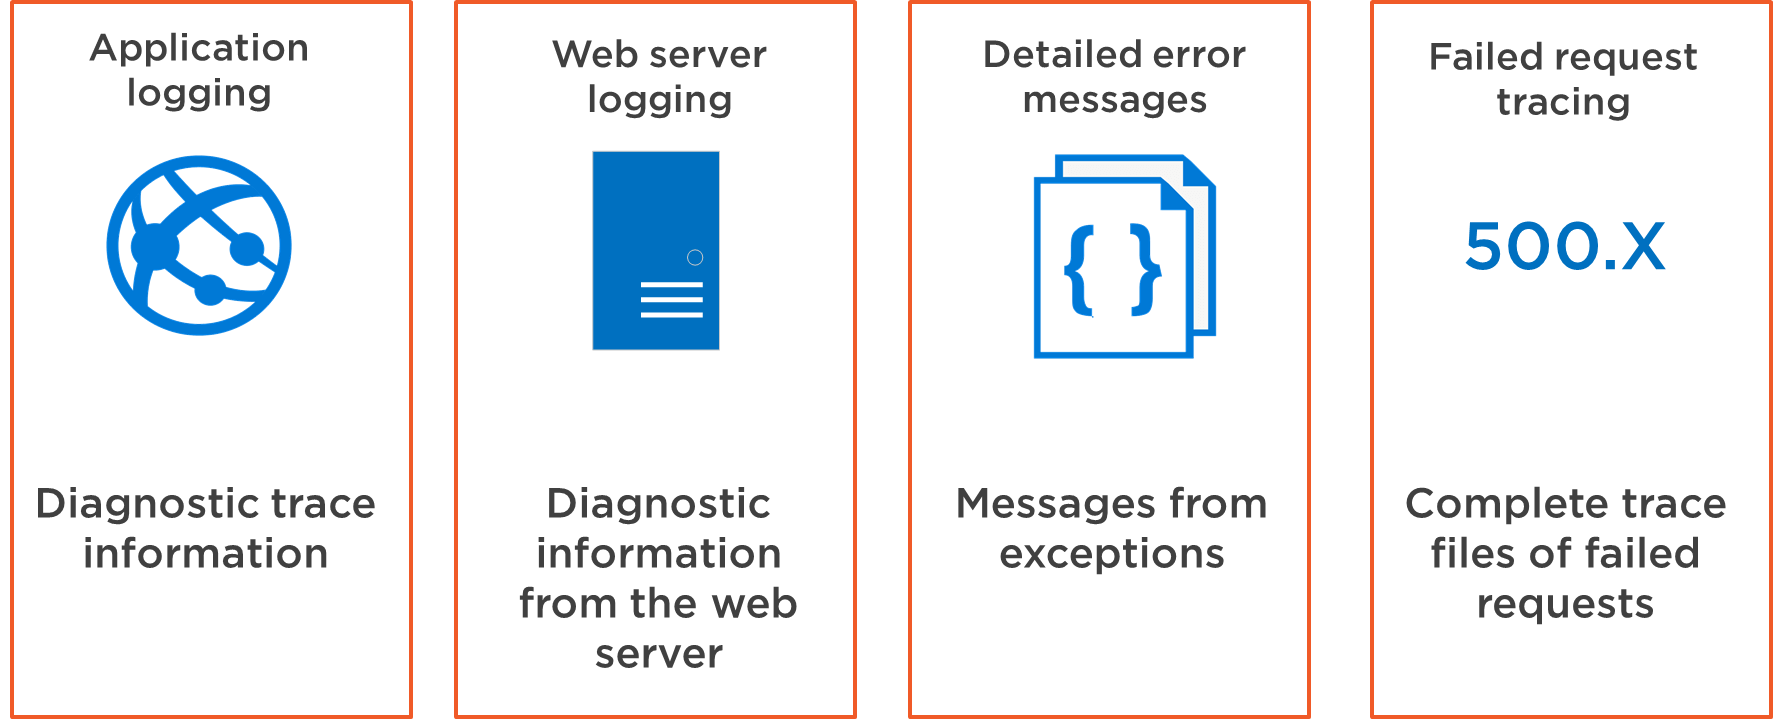
The primary log types you'll encounter are:
- Application Logging: Captures trace messages generated by your application code. As a .NET developer, these are the logs you create using an
ILoggerinterface. - Web Server Logging: Provides raw HTTP request information in the standard W3C format, showing details like the request method, client IP, and HTTP status code.
- Detailed Error Messages: Saves HTML pages for failed requests (HTTP status 400 or higher), which can sometimes provide more context than a generic error message.
- Failed Request Tracing: Offers highly detailed traces for failed requests, tracking the request through the IIS pipeline. This is particularly useful for diagnosing performance issues or complex authentication problems on Windows-based App Services.
- Deployment Logging: Records logs related to the content publishing process, which are invaluable for debugging failed deployments.
To get a formal overview of these types, please review the introduction from the official Microsoft documentation.
Enable Diagnostic Logging - Azure App Service - Microsoft Learn
This table from the Microsoft Learn documentation provides a concise summary of each log type, its platform availability, and where it's stored. It's an excellent reference to start with.
Read the section 'Overview of logging types'. Pay attention to the 'Description' column in the table to understand the purpose of each log category.
Configuring and Accessing Diagnostic Logs
Let's get hands-on. We'll focus on Application Logging, as it's the most common type you'll interact with as a developer. We will configure our ASP.NET Core application to send logs to Azure and then view them.
There are three primary destinations for your application logs:
- App Service Filesystem: Quick and easy for temporary debugging. The logs are stored on the same virtual machine as your app.
- Azure Blob Storage: A more persistent, long-term storage solution that decouples logs from the application's compute instance.
- Application Insights: An advanced monitoring service that provides rich analytics, distributed tracing, and powerful querying capabilities.
The following video is an excellent guide for .NET developers, as it covers both the Azure Portal configuration and the necessary code changes.
Azure Logging for Asp.Net Core Developers
The 'Codewrinkles' channel has produced a video specifically for ASP.NET Core developers. It clearly demonstrates how to set up logging to the filesystem and Blob Storage.
Watch the segments covering the introduction, filesystem logging, and blob storage logging (00:00 - 09:54). As you watch, pay attention to: The code change in Program.cs to add the Azure logging provider. The steps to enable 'Application Logging (Filesystem)' and 'Application Logging (Blob)' in the Azure Portal. How to access the generated log files using Kudu (for filesystem) and by navigating to the storage account (for blob).
Hands-On Steps:
Let's apply what you just saw to your MyFirstAzureWebApp.
1. Update Your Application Code
Your existing .NET project is likely already configured to use the default logging providers. To ensure logs are correctly routed to Azure's diagnostic services, you need to add the Azure App Service provider.
Open your MyFirstAzureWebApp project in Visual Studio and modify your Program.cs file. Find the line var builder = WebApplication.CreateBuilder(args); and add the logging configuration right after it.
var builder = WebApplication.CreateBuilder(args);

// Add the Azure App Service diagnostics logging provider
builder.Logging.AddAzureWebAppDiagnostics();

// Add services to the container.
builder.Services.AddRazorPages();

//... rest of the file
This single line of code is the bridge between the standard .NET ILogger and the App Service logging infrastructure. Now, redeploy your application to Azure.
2. Configure Logging in the Azure Portal
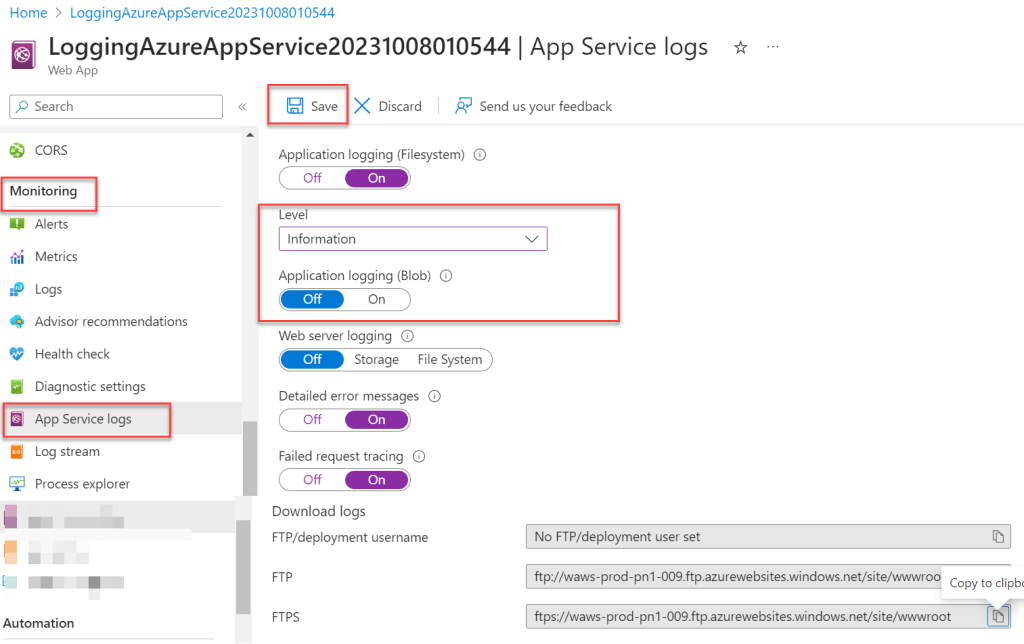
- Navigate to your App Service in the Azure Portal.
- Under the Monitoring section in the left menu, select App Service logs.
- For Filesystem Logging:
- Turn Application logging (Filesystem) to On.
- Set the Level to Information. Note that filesystem logging is automatically turned off after 12 hours.
- For Blob Storage Logging:
- Turn Application logging (Blob) to On.
- Set the Level to Information.
- You will need to select a Storage account and a Container. If you don't have one, Azure will guide you to create one. This is where your logs will be persistently stored.
- Set a Retention Period (Days).
- Click Save.
Real-Time Troubleshooting with Log Stream
Waiting to download log files can be slow, especially when you're actively trying to debug a live issue. App Service provides a Log Stream feature that gives you a real-time view of the logs being generated by your application.
This is one of the most useful features for immediate feedback. As soon as you enable either Filesystem or Blob application logging, you can access the log stream.
Azure Logging for Asp.Net Core Developers
Let's return to the 'Codewrinkles' video to see the Log Stream feature in action. This is a powerful tool for live debugging.
Watch the segment on Log Stream (09:54 - 12:10). Notice how a request made to the application instantly appears in the log stream console.
Try It Yourself:
- In your App Service, navigate to Log stream under the Monitoring section.
- Open a new browser tab and navigate to your web app's URL.
- Refresh your web app page a few times.
- Switch back to the Log Stream tab. You should see the log messages from your application appearing in near real-time.
You can also use the Azure CLI for this, which might be faster if you're already working in a terminal.
# Log in to Azure if you haven't already
az login


# Stream logs for your web app
az webapp log tail --name <your-app-name> --resource-group <your-resource-group-name>
Advanced Monitoring with Application Insights
While filesystem and blob storage logging are great for basic diagnostics, modern distributed applications require a more powerful solution. Azure Application Insights is an Application Performance Management (APM) service that provides deep insights into your application's performance and usage.
Think of it as logging on steroids. It not only captures application traces but also:
- Tracks incoming requests, response times, and failure rates.
- Monitors outgoing dependency calls (e.g., to databases, REST APIs) and their performance.
- Collects and aggregates exceptions, allowing you to identify the most common errors.
- Provides a visual Application Map of your system's components.
- Enables powerful querying over all telemetry data using Kusto Query Language (KQL).
Azure Application Insights Tutorial | Amazing telemetry service
This tutorial by Adam Marczak provides an excellent overview of what Application Insights is and demonstrates its most powerful troubleshooting features.
Watch the following segments: What is Application Insights? (00:18 - 03:38): This explains the purpose of App Insights as an APM service. Live Metrics Stream (16:03 - 17:50): See the rich, real-time telemetry stream. Failure Analysis (26:50 - 30:52): This is a key part. See how you can trace an error from a high-level view down to the exact line of code that caused it. This will directly appeal to your developer experience.
Enabling Application Insights is straightforward and highly recommended for any production application. You can enable it when you create an App Service, or add it to an existing one from the Application Insights blade in the portal. Doing so adds an APPLICATIONINSIGHTS_CONNECTION_STRING to your app settings, which the .NET SDK automatically uses to send telemetry.
Given its power, we will dive deeper into Application Insights, especially KQL queries, in Module 10. For now, the key is to recognize it as the primary tool for serious monitoring and diagnostics in Azure.
Conclusion
You have now learned how to equip your application with the diagnostics it needs to be monitored and maintained effectively. Understanding and using these logging capabilities is non-negotiable for a professional Azure developer.
Key Takeaways:
- App Service provides multiple log types, with Application Logging being the most critical for developers.
- Basic logging can be directed to the Filesystem for short-term debugging or Blob Storage for long-term persistence.
- The Log Stream feature offers a real-time console view of your logs, which is invaluable for live troubleshooting.
- Application Insights is the recommended enterprise-grade solution for comprehensive performance monitoring, distributed tracing, and advanced failure analysis.
- Your existing .NET
ILoggerknowledge integrates seamlessly with Azure's logging infrastructure via theAddAzureWebAppDiagnostics()extension method.
Next Steps
Now that your application is deployed, configured, and monitored, the next logical step is to ensure it can handle varying loads. In our next lesson, we will tackle the learning outcome: "Scale an App Service app manually (scale up) and automatically (scale out) based on performance metrics." The monitoring skills you've just learned are a direct prerequisite for making intelligent scaling decisions.