Hello! Welcome to Module 10 of our AZ-204 preparation course.
In the previous module, we focused on optimizing application performance through caching with Azure Cache for Redis and Azure CDN. Now, we pivot to another essential aspect of building and maintaining robust cloud applications: monitoring and troubleshooting. When your application is deployed, especially in a distributed environment, how do you know if it's healthy? How do you diagnose problems when they occur? This module is dedicated to answering those questions.
Today's lesson is the starting point for this journey. We will explore the Azure Monitor ecosystem, the centralized platform for observability in Azure. Your goal for this lesson is to be able to describe its core components, including the different types of data it collects—metrics and logs—and how you can proactively respond to that data using alerts. Mastering these fundamental concepts is crucial for the hands-on lessons that will follow and is a key knowledge area for the AZ-204 exam.
1. The Big Picture: What is Azure Monitor?
As an experienced developer, you understand the importance of having a feedback loop from your production systems. In complex, distributed cloud applications, this "observability" isn't a luxury; it's a necessity. Azure Monitor is Microsoft's unified solution for providing this observability across your entire technology stack.
To get a concise, high-level overview of what Azure Monitor is and the problems it solves, please watch the following introductory video from Microsoft.
This video, 'What is Azure Monitor?', provides a quick and clear introduction to the service, its purpose, and its main components.
Watch the video from the beginning until 03:51. Pay attention to the types of data sources it can pull from, the distinction between metrics and logs, and the ways you can act on the collected data.
As the video explained, Azure Monitor is a comprehensive platform that collects telemetry, analyzes it, and allows you to act on it. This can be visualized as a continuous flow:

A common point of confusion for newcomers is the relationship between Azure Monitor, Log Analytics, and Application Insights. To clarify this, let's turn to the official documentation.
Azure Monitor overview - Microsoft
The article 'Azure Monitor overview' from Microsoft Learn contains a helpful FAQ that clarifies the history and relationship between these services.
Please read the FAQ section titled 'What's the difference between Azure Monitor, Log Analytics, and Application Insights?'. This will help you understand that Azure Monitor is the single, unified service that now encompasses the features of the others.
In short: Azure Monitor is the modern, unified brand. Log Analytics is now often referred to as Azure Monitor Logs, and Application Insights is a feature within Azure Monitor focused on Application Performance Management (APM).
2. The Core Data Types: Metrics vs. Logs
Azure Monitor's data platform is built on two fundamental types of data: metrics and logs. Understanding the difference is essential because they are stored, processed, and used for different purposes.
- Metrics: These are numerical values collected at regular intervals that describe some aspect of a system at a particular point in time. They are lightweight and ideal for near-real-time alerting and performance analysis.
- Example: CPU percentage, server response time, number of requests per second.
- Logs: These are structured or unstructured records of events that occurred. They contain rich contextual information and are ideal for deep troubleshooting, root cause analysis, and auditing.
- Example: An application error with a stack trace, a record of a user sign-in, the result of a database query.
The following resource provides a clear and concise comparison.
The missing guide to understanding monitoring on Azure
The blog post 'The missing guide to understanding monitoring on Azure' includes a simple but effective table that contrasts metrics and logs.
Find the section 'Metrics vs. Logs' and study the table comparing their format, best use cases, examples, and storage location. This provides a great at-a-glance summary.
From a developer's perspective, it's also important to distinguish these from tracing. While logs tell you what happened at a point in time, traces show the journey of a single request as it flows through multiple services in a distributed system.
The following video segment provides an excellent developer-centric explanation of these different instrumentation types.
Logging, tracing and metrics: instrumentation in .NET and Azure - Alex Thissen - NDC London 2023
This talk from NDC London clarifies the distinct purposes of logging, tracing, metrics, and health checks.
Watch from 08:13 to 11:32. The speaker does a great job of defining each concept and emphasizes an important best practice: 'don't misuse logging for tracing.'
All log data in Azure Monitor is sent to a Log Analytics Workspace. Think of this workspace as the "brain" for your log data. It's a centralized repository where you can run powerful queries using the Kusto Query Language (KQL) to analyze data from all your resources in one place. We will dive deep into KQL in a later lesson.
3. Taking Action: Alerts
Collecting data is only half the battle. A robust monitoring system must be able to act on that data proactively. In Azure Monitor, this is primarily achieved through Alerts.
An alert rule allows you to define a condition and a corresponding set of actions. When the condition is met, the alert "fires," and your specified actions are triggered.
There are two primary types of alert rules, corresponding to the two data types we just discussed:
- Metric Alerts: Triggered when a metric value crosses a defined threshold (e.g.,
CPU Percentage > 90% for 5 minutes). These are evaluated frequently and provide near-real-time notifications. - Log Alerts: Triggered based on the results of a KQL query that runs on a schedule (e.g.,
count of HTTP 500 errors in the last 15 minutes > 10). These allow for much more complex and powerful conditions.
When an alert fires, it triggers an Action Group. An action group is a reusable collection of actions, such as:
- Sending an email or SMS
- Making a voice call
- Calling a webhook to trigger an external process
- Executing an Azure Function or Logic App to perform automated remediation
The following diagram illustrates this entire workflow beautifully.
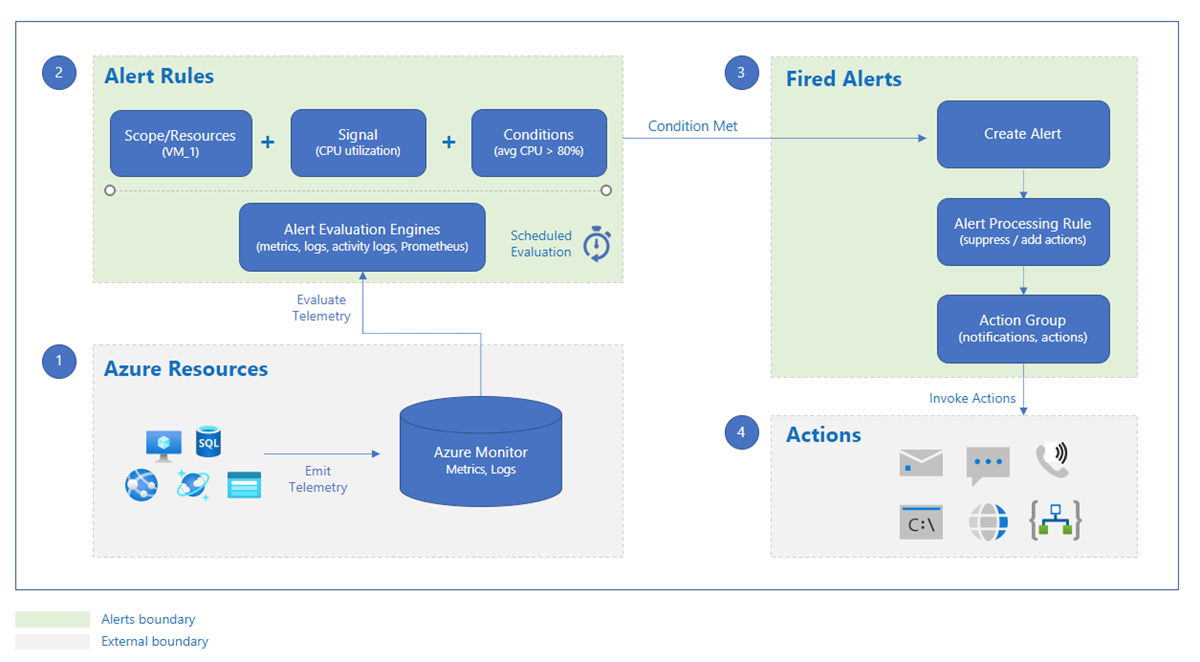
To solidify your understanding of this workflow, read the official description.
Azure Monitor overview - Microsoft
Let's return to the 'Azure Monitor overview' documentation to read about the 'Respond' capability, which focuses on alerts and autoscale.
Read the section titled 'Respond'. Focus on the descriptions of Azure Monitor Alerts, the distinction between metric and log alert rules, and the role of Action Groups.
Conclusion
In this lesson, you've gained a foundational understanding of the Azure Monitor ecosystem. This is the bedrock upon which all monitoring, troubleshooting, and performance analysis in Azure is built.
Key Takeaways:
- Azure Monitor is the unified platform for achieving observability across your cloud and on-premises environments.
- It collects two primary types of data: Metrics (lightweight, numerical time-series data for performance) and Logs (rich, event-based data for deep analysis).
- Log data is stored and queried in a Log Analytics Workspace using KQL.
- Alerts allow you to proactively respond to critical conditions detected in your metrics or logs by triggering Action Groups.
Next Steps
Now that you understand the "what" and "why" of Azure Monitor, our next lesson will move into the "how." We will take the first practical step by enabling and configuring Application Insights for a .NET web application. You'll see how to instrument your code to automatically start collecting the metrics, logs, and traces we've discussed today.